Inicie sesión para participar
I found this list on Book Authority about the top MATLAB books: https://bookauthority.org/books/best-matlab-books
My favorite book is Accelerating MATLAB Performance - 1001 tips to speed up MATLAB programs. I always pick something up from the book that helps me out.
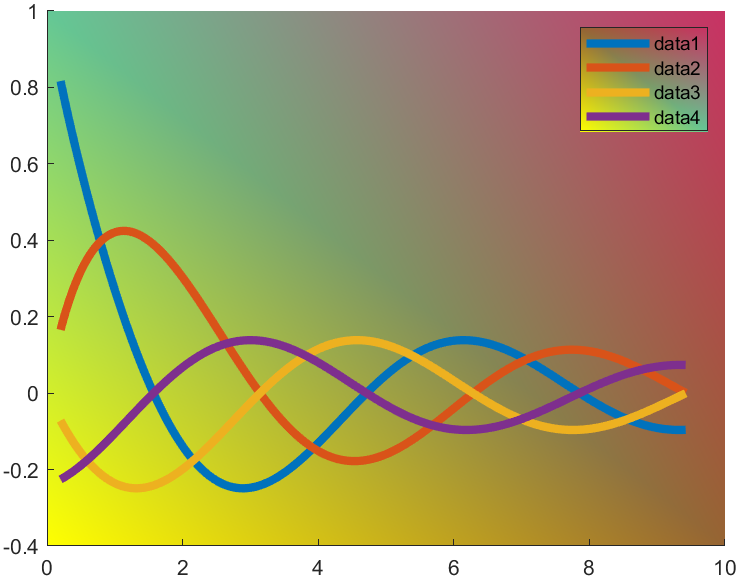
t=0.2:0.01:3*pi;
hold on
plot(t,cos(t)./(1+t),'LineWidth',4)
plot(t,sin(t)./(1+t),'LineWidth',4)
plot(t,cos(t+pi/2)./(1+t+pi/2),'LineWidth',4)
plot(t,cos(t+pi)./(1+t+pi),'LineWidth',4)
ax=gca;
hLegend=legend();
pause(1e-16)
colorData = uint8([255, 150, 200, 100; ...
255, 100, 50, 200; ...
0, 50, 100, 150; ...
102, 150, 200, 50]);
set(ax.Backdrop.Face, 'ColorBinding','interpolated','ColorData',colorData);
set(hLegend.BoxFace,'ColorBinding','interpolated','ColorData',colorData)
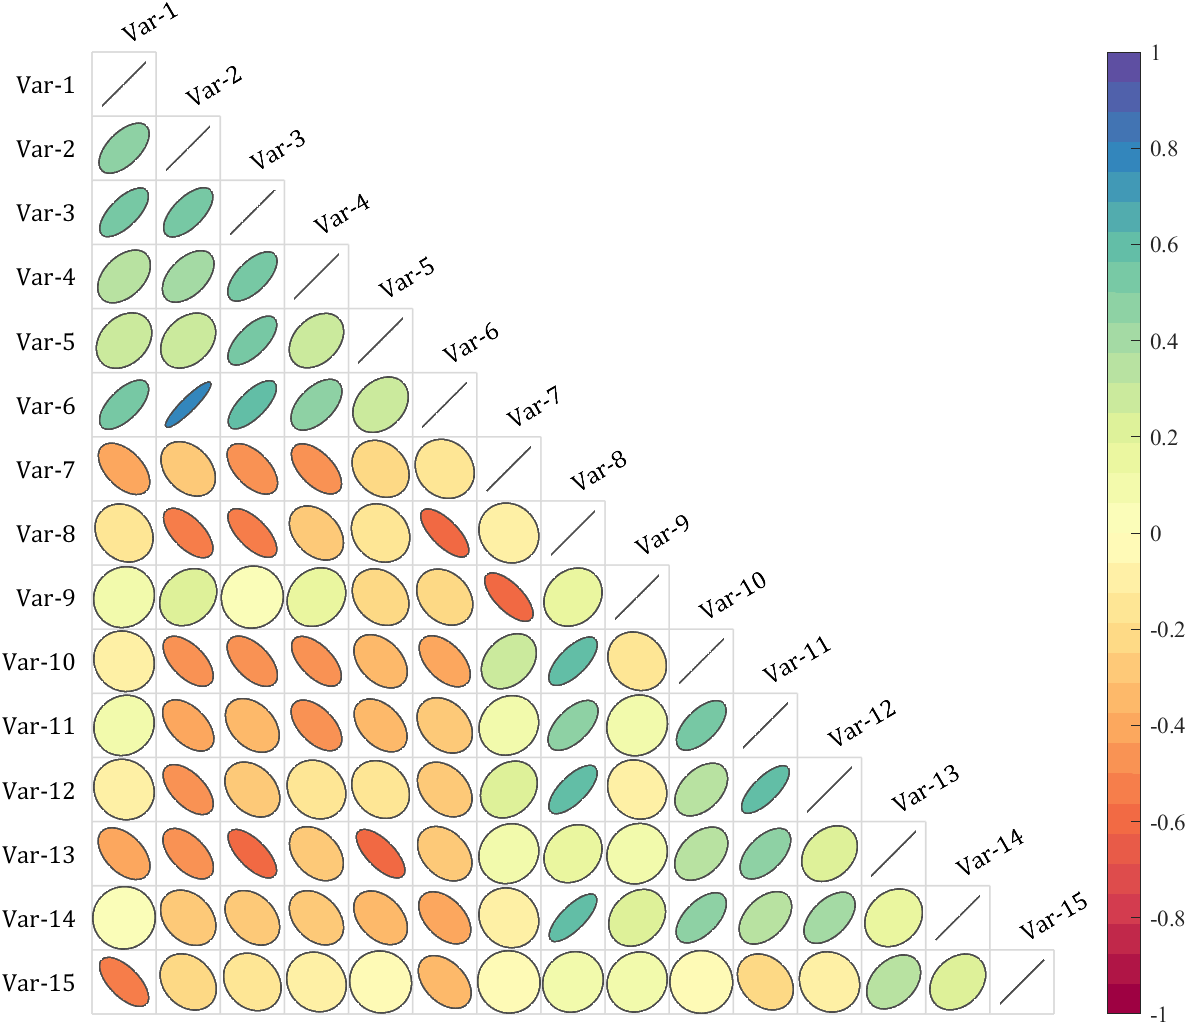
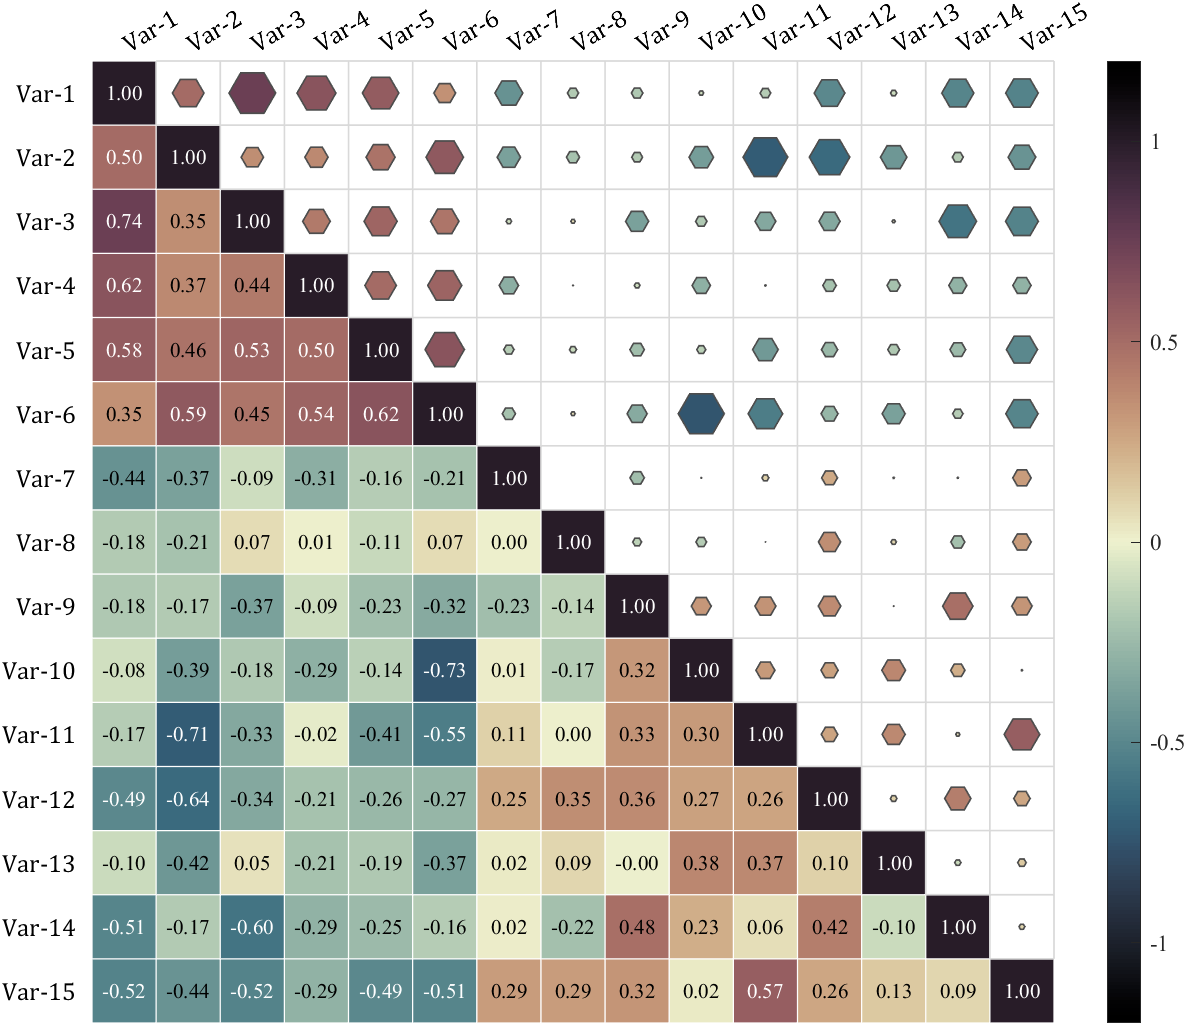
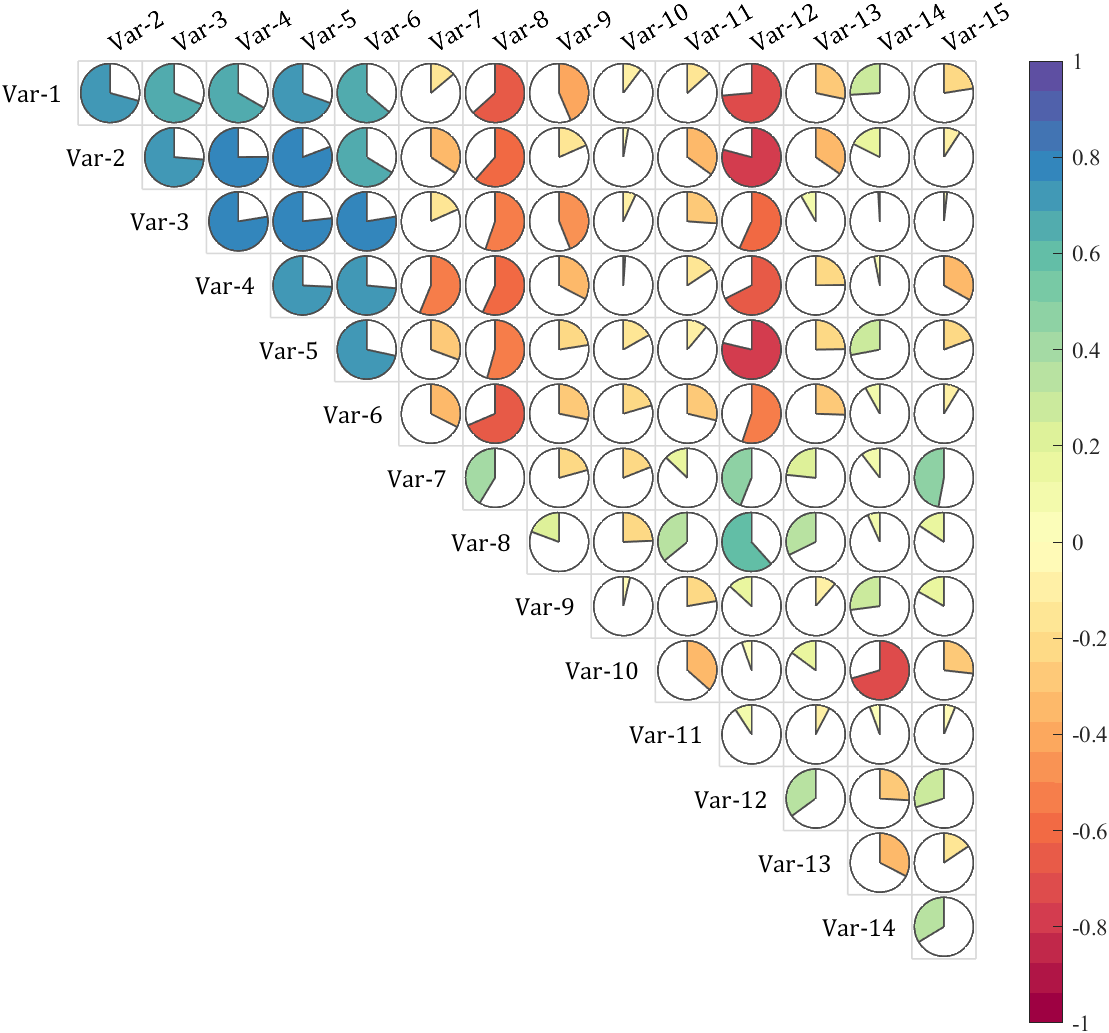
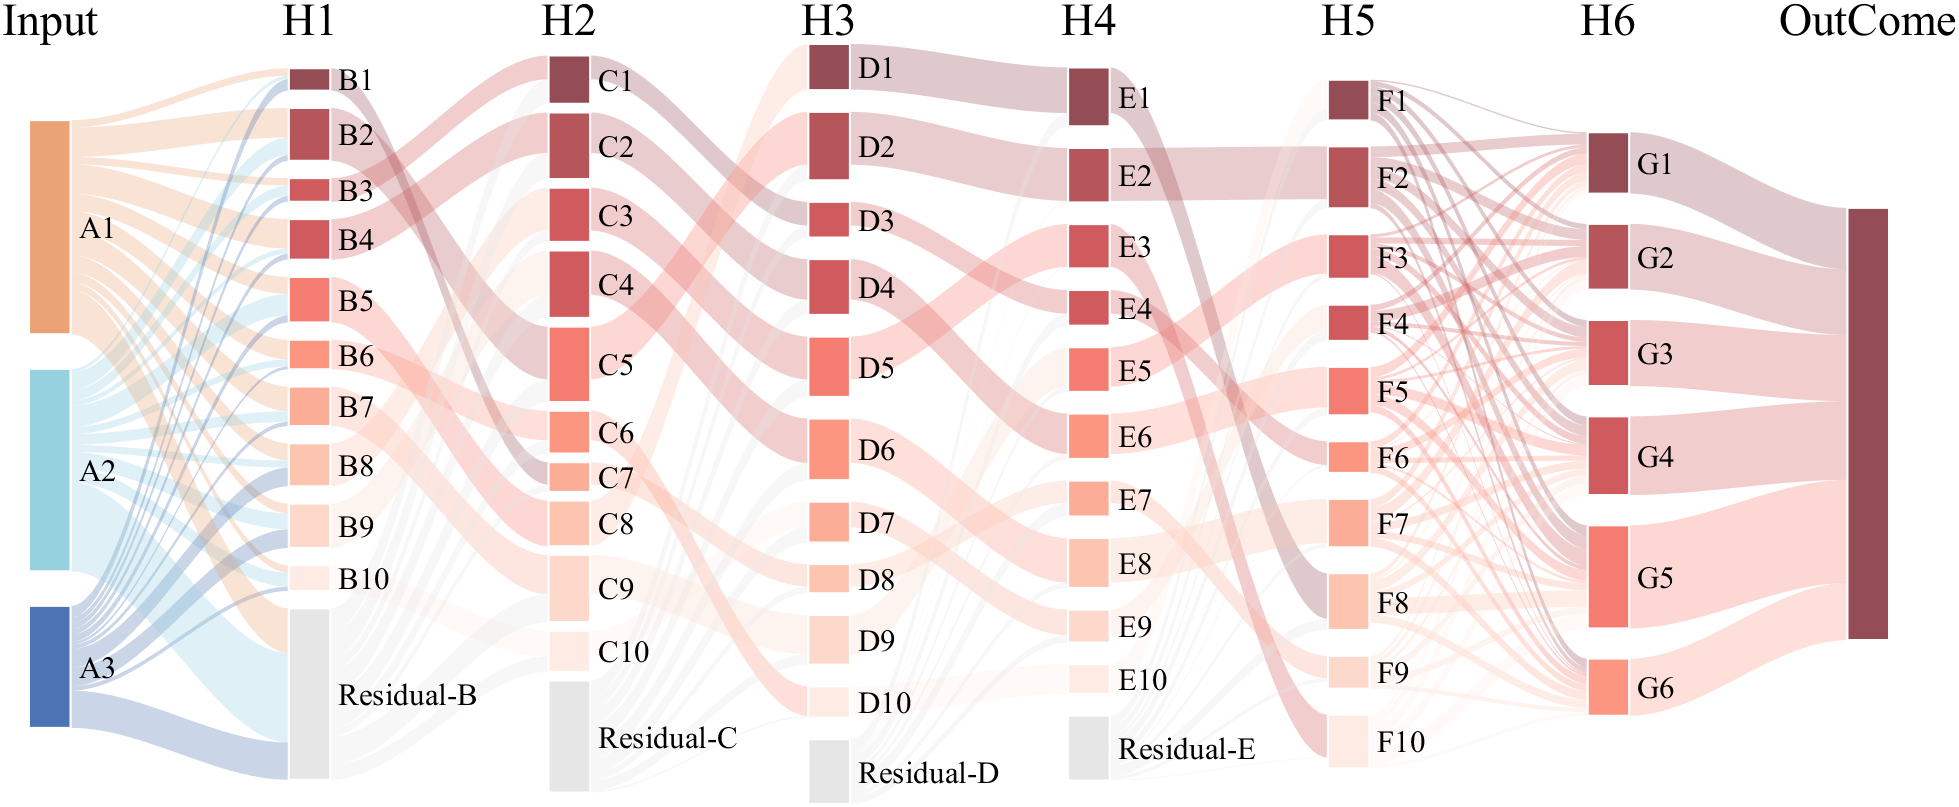
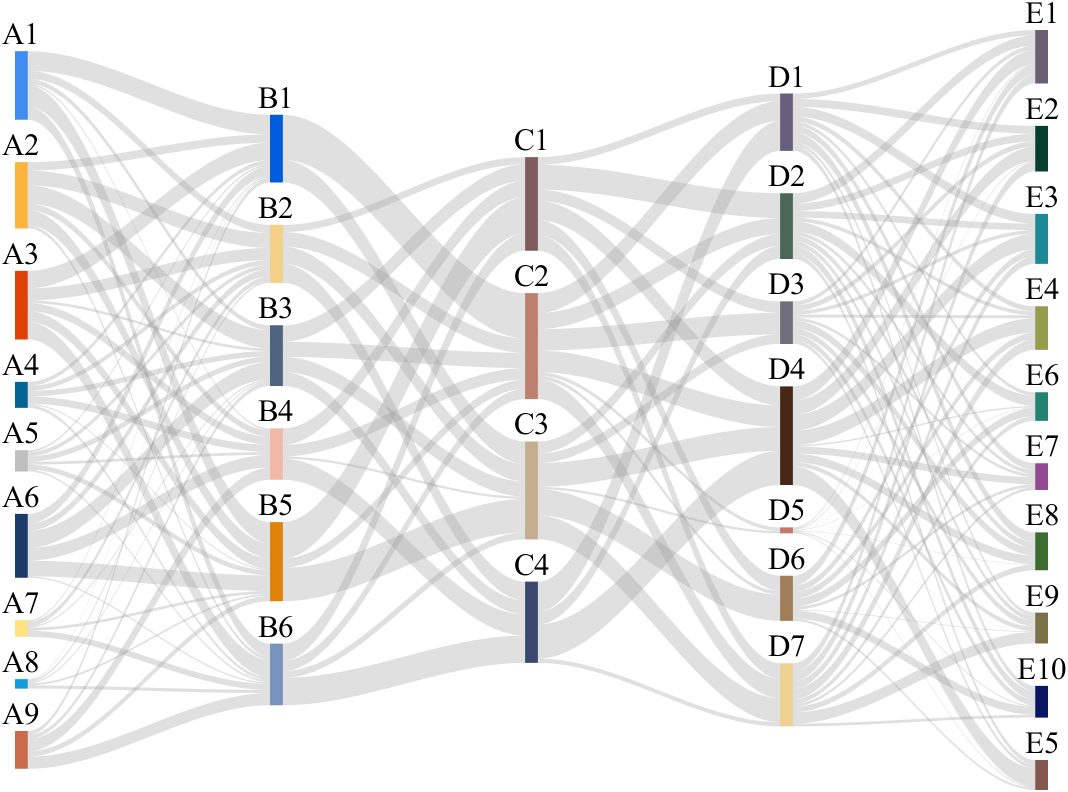
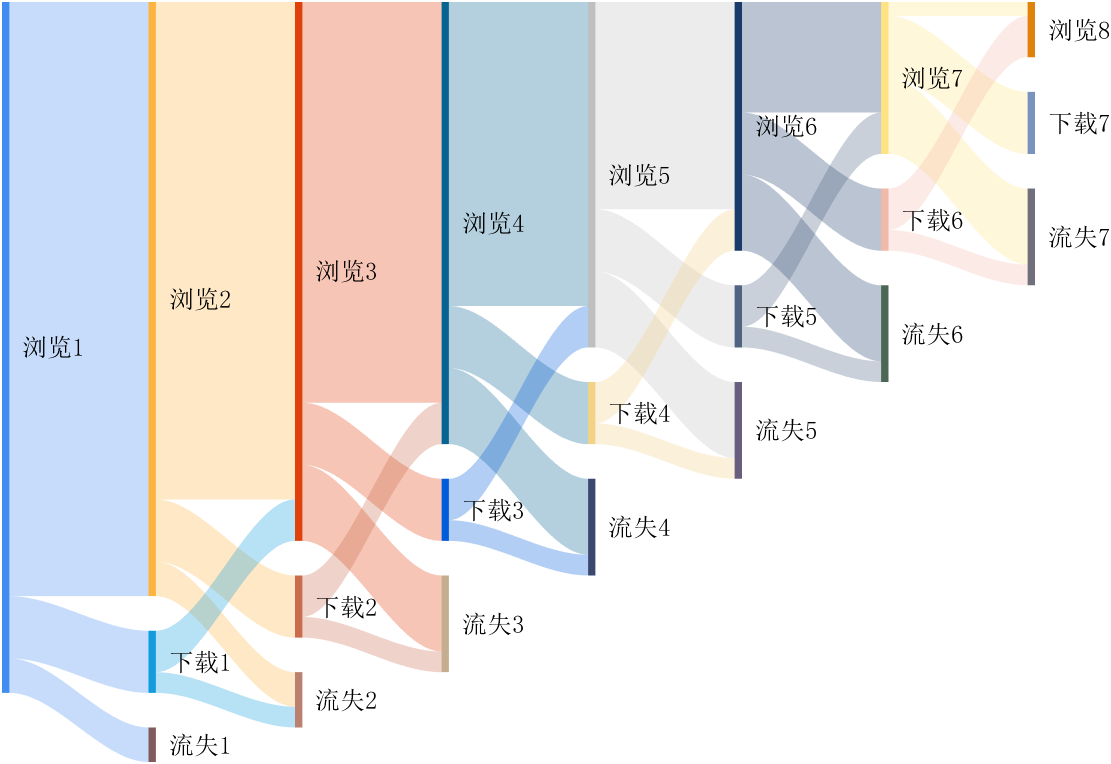
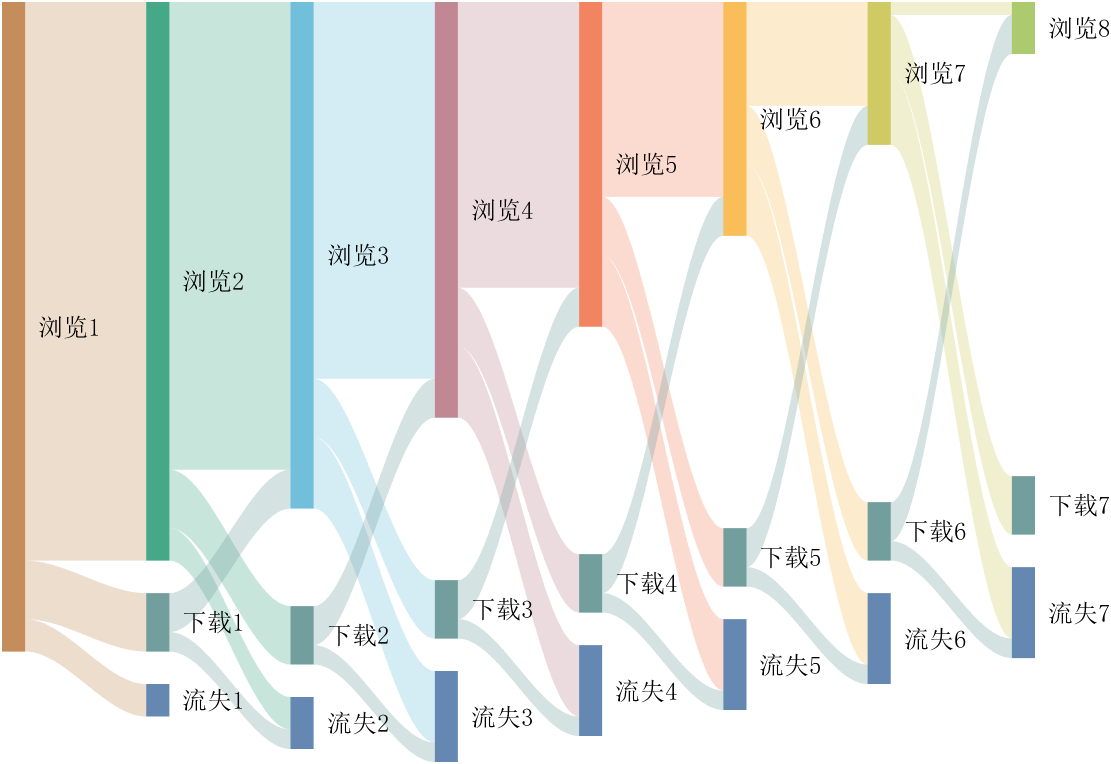
It is pretty easy to draw a cool heatmap for I have uploaded a tool to fileexchange:

It is easy to obtain sankey plot like that using my tool:


function dragon24
% Copyright (c) 2024, Zhaoxu Liu / slandarer
baseV=[ -.016,.822; -.074,.809; -.114,.781; -.147,.738; -.149,.687; -.150,.630;
-.157,.554; -.166,.482; -.176,.425; -.208,.368; -.237,.298; -.284,.216;
-.317,.143; -.338,.091; -.362,.037;-.382,-.006;-.420,-.051;-.460,-.084;
-.477,-.110;-.430,-.103;-.387,-.084;-.352,-.065;-.317,-.060;-.300,-.082;
-.331,-.139;-.359,-.201;-.385,-.262;-.415,-.342;-.451,-.418;-.494,-.510;
-.533,-.599;-.569,-.675;-.607,-.753;-.647,-.829;-.689,-.932;-.699,-.988;
-.639,-.905;-.581,-.809;-.534,-.717;-.489,-.642;-.442,-.543;-.393,-.447;
-.339,-.362;-.295,-.296;-.251,-.251;-.206,-.241;-.183,-.281;-.175,-.350;
-.156,-.434;-.136,-.521;-.128,-.594;-.103,-.677;-.083,-.739;-.067,-.813;-.039,-.852];
% 基础比例、上色方式数据
baseV=[0,.82;baseV;baseV(end:-1:1,:).*[-1,1];0,.82];
baseV=baseV-mean(baseV,1);
baseF=1:size(baseV,1);
baseY=baseV(:,2);
baseY=(baseY-min(baseY))./(max(baseY)-min(baseY));
N=30;
baseR=sin(linspace(pi/4,5*pi/6,N))./1.2;
baseR=[baseR',baseR'];baseR(1,:)=[1,1];
baseR(5,:)=[2,.6];
baseR(10,:)=[3.7,.4];
baseR(15,:)=[1.8,.6];
baseT=[zeros(N,1),ones(N,1)];
baseM=zeros(N,2);
baseD=baseM;
ratioT=@(Mat,t)Mat*[cos(t),sin(t);-sin(t),cos(t)];
% 配色数据
CList=[211,56,32;56,105,166;253,209,95]./255;
% CList=bone(4);CList=CList(2:4,:);
% CList=flipud(bone(3));
% CList=lines(3);
% CList=colorcube(3);
% CList=rand(3)
baseC1=CList(2,:)+baseY.*(CList(1,:)-CList(2,:));
baseC2=CList(3,:)+baseY.*(CList(1,:)-CList(3,:));
% 构建图窗
fig=figure('units','normalized','position',[.1,.1,.5,.8],...
'UserData',[98,121,32,115,108,97,110,100,97,114,101,114]);
axes('parent',fig,'NextPlot','add','Color',[0,0,0],...
'DataAspectRatio',[1,1,1],'XLim',[-6,6],'YLim',[-6,6],'Position',[0,0,1,1]);
% 构造龙每个部分句柄
dragonHdl(1)=patch('Faces',baseF,'Vertices',baseV,'FaceVertexCData',baseC1,'FaceColor','interp','EdgeColor','none','FaceAlpha',.95);disp(char(fig.UserData))
for i=2:N
dragonHdl(i)=patch('Faces',baseF,'Vertices',baseV.*baseR(i,:)-[0,i./2.5-.3],'FaceVertexCData',baseC2,'FaceColor','interp','EdgeColor','none','FaceAlpha',.7);
end
set(dragonHdl(5),'FaceVertexCData',baseC1,'FaceAlpha',.7)
set(dragonHdl(10),'FaceVertexCData',baseC1,'FaceAlpha',.7)
set(dragonHdl(15),'FaceVertexCData',baseC1,'FaceAlpha',.7)
for i=N:-1:1,uistack(dragonHdl(i),'top');end
for i=1:N
baseM(i,:)=mean(get(dragonHdl(i),'Vertices'),1);
end
baseD=diff(baseM(:,2));Pos=[0,2];
% 主循环及旋转、运动计算
set(gcf,'WindowButtonMotionFcn',@dragonFcn)
fps=8;
game=timer('ExecutionMode', 'FixedRate', 'Period',1/fps, 'TimerFcn', @dragonGame);
start(game)
% Copyright (c) 2023, Zhaoxu Liu / slandarer
set(gcf,'tag','co','CloseRequestFcn',@clo);
function clo(~,~)
stop(game);delete(findobj('tag','co'));clf;close
end
function dragonGame(~,~)
Dir=Pos-baseM(1,:);
Dir=Dir./norm(Dir);
baseT=(baseT(1:end,:)+[Dir;baseT(1:end-1,:)])./2;
baseT=baseT./(vecnorm(baseT')');
theta=atan2(baseT(:,2),baseT(:,1))-pi/2;
baseM(1,:)=baseM(1,:)+(Pos-baseM(1,:))./30;
baseM(2:end,:)=baseM(1,:)+[cumsum(baseD.*baseT(2:end,1)),cumsum(baseD.*baseT(2:end,2))];
for ii=1:N
set(dragonHdl(ii),'Vertices',ratioT(baseV.*baseR(ii,:),theta(ii))+baseM(ii,:))
end
end
function dragonFcn(~,~)
xy=get(gca,'CurrentPoint');
x=xy(1,1);y=xy(1,2);
Pos=[x,y];
Pos(Pos>6)=6;
Pos(Pos<-6)=6;
end
end
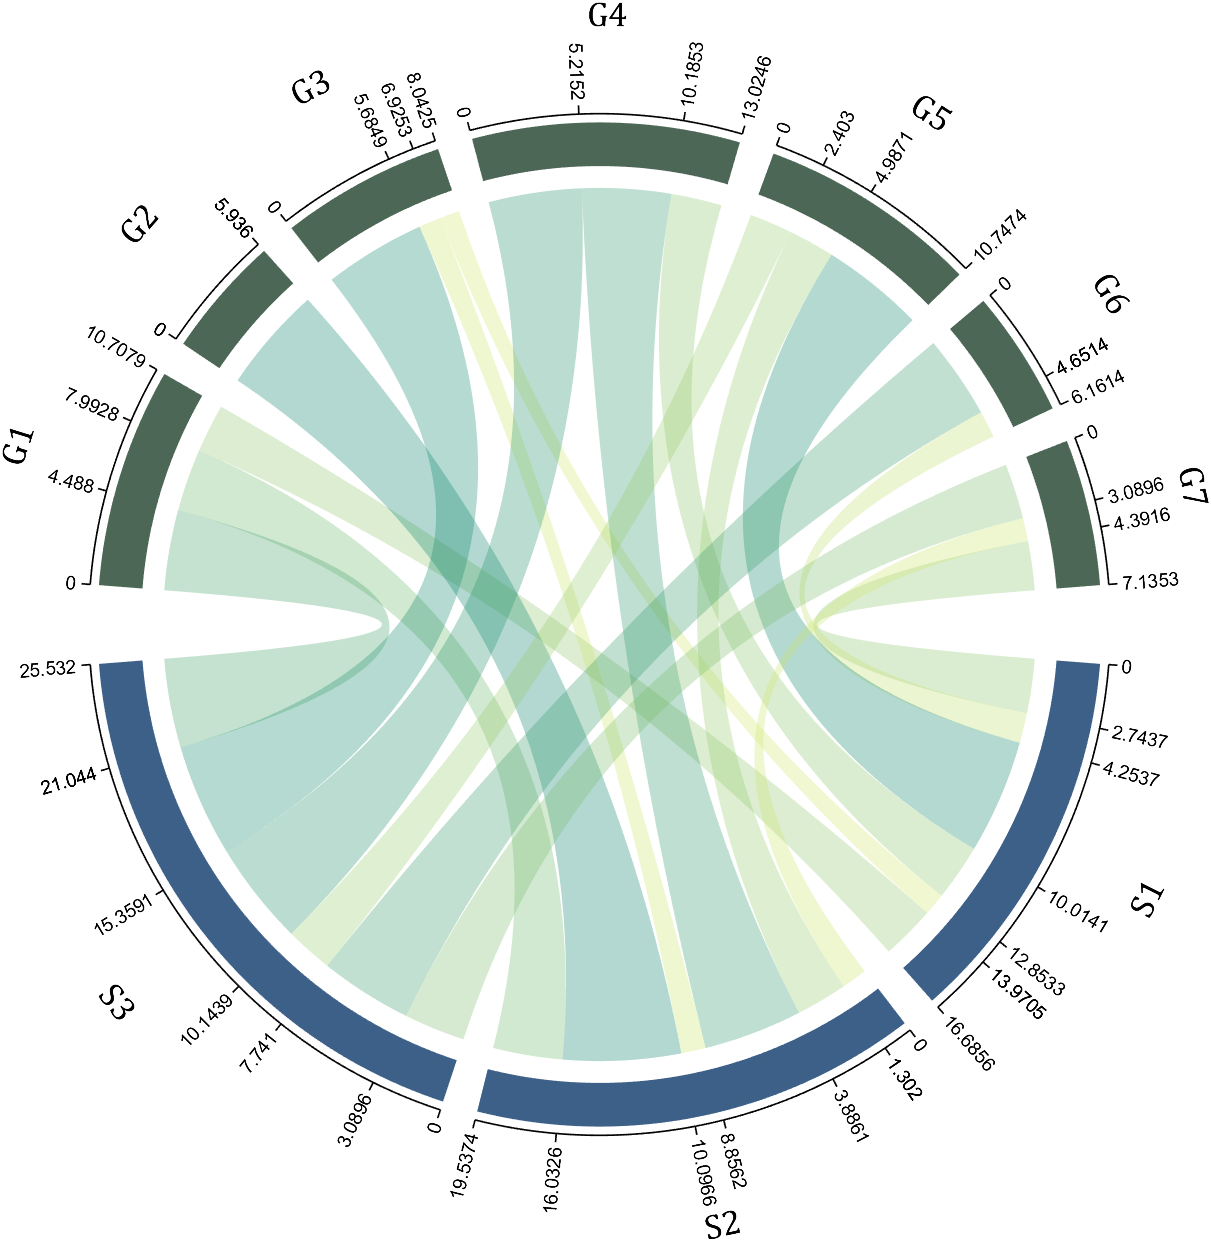
I have written two tools and uploaded fileexchange, which allows us to easily draw chord diagrams:

chord chart 弦图
download:
demo:
dataMat=[2 0 1 2 5 1 2;
3 5 1 4 2 0 1;
4 0 5 5 2 4 3];
dataMat=dataMat+rand(3,7);
dataMat(dataMat<1)=0;
colName={'G1','G2','G3','G4','G5','G6','G7'};
rowName={'S1','S2','S3'};
CC=chordChart(dataMat,'rowName',rowName,'colName',colName);
CC=CC.draw();
CC.setFont('FontSize',17,'FontName','Cambria')
% 显示刻度和数值
% Displays scales and numeric values
CC.tickState('on')
CC.tickLabelState('on')
% 调节标签半径
% Adjustable Label radius
CC.setLabelRadius(1.4);
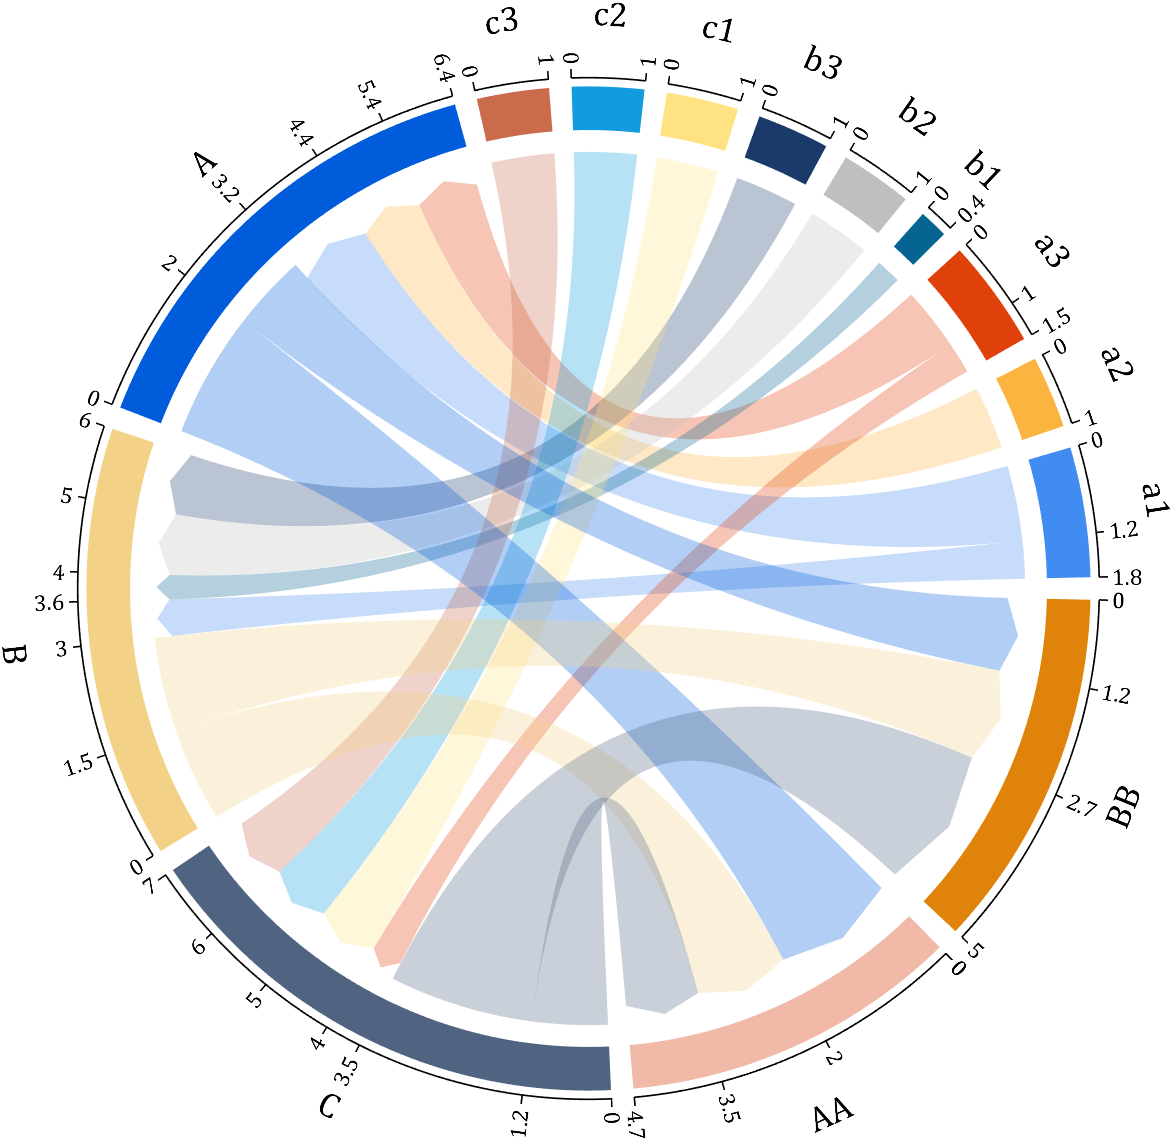
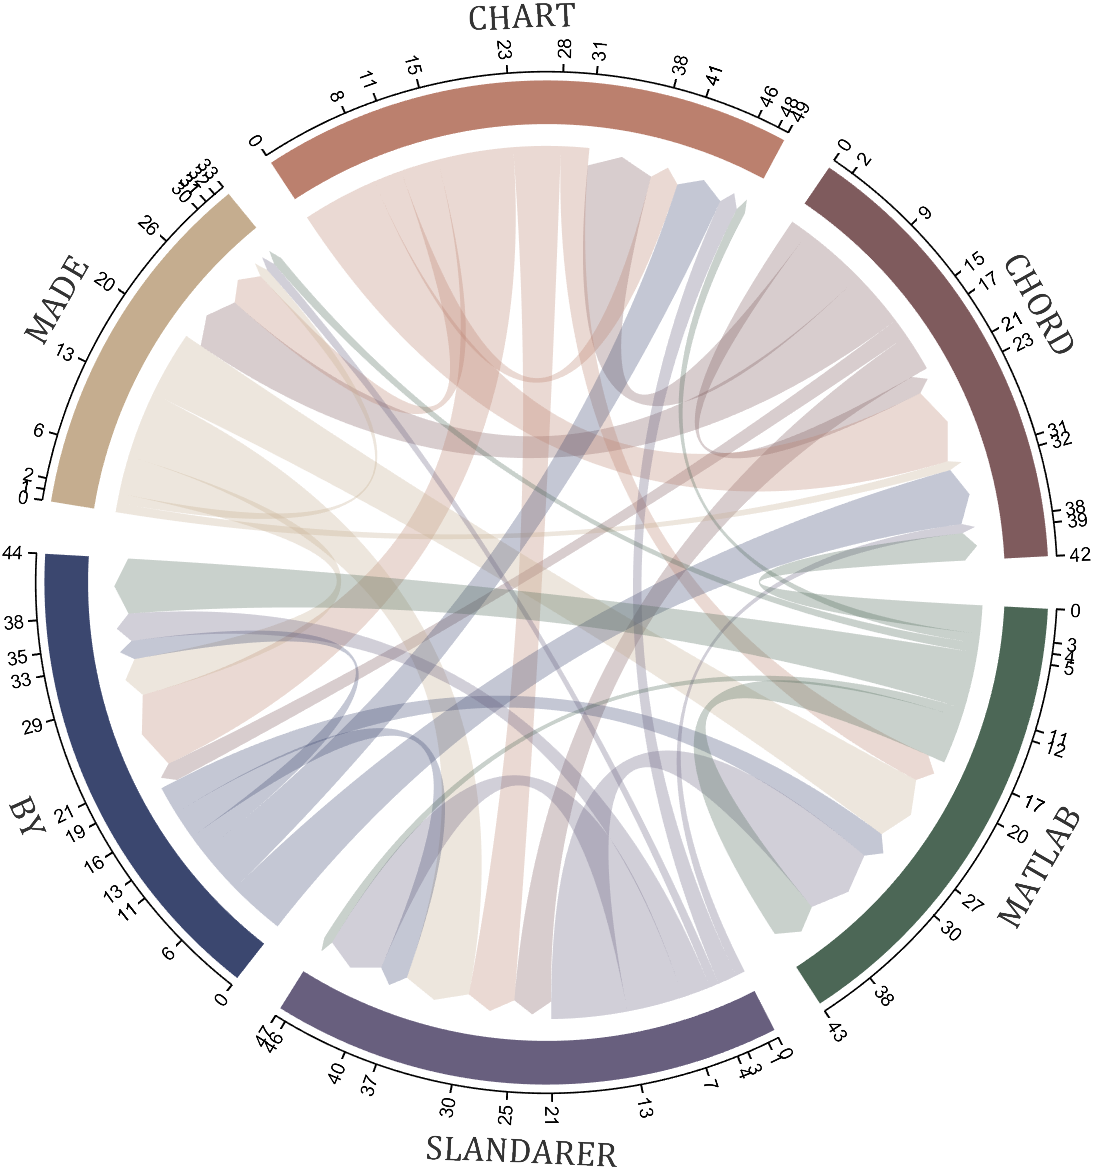
Digraph chord chart 有向弦图
download:
demo:
dataMat=randi([0,8],[6,6]);
% 添加标签名称
NameList={'CHORD','CHART','MADE','BY','SLANDARER','MATLAB'};
BCC=biChordChart(dataMat,'Label',NameList,'Arrow','on');
BCC=BCC.draw();
% 添加刻度
BCC.tickState('on')
% 修改字体,字号及颜色
BCC.setFont('FontName','Cambria','FontSize',17,'Color',[.2,.2,.2])
BCC.setLabelRadius(1.3);
BCC.tickLabelState('on')
There will be a warning when we try to solve equations with piecewise:
syms x y
a = x+y;
b = 1.*(x > 0) + 2.*(x <= 0);
eqns = [a + b*x == 1, a - b == 2];
S = solve(eqns, [x y]);
% 错误使用 mupadengine/feval_internal
% System contains an equation of an unknown type.
%
% 出错 sym/solve (第 293 行)
% sol = eng.feval_internal('solve', eqns, vars, solveOptions);
%
% 出错 demo3 (第 5 行)
% S=solve(eqns,[x y]);
But I found that the solve function can include functions such as heaviside to indicate positive and negative:
syms x y
a = x+y;
b = floor(heaviside(x)) - 2*abs(2*heaviside(x) - 1) + 2*floor(-heaviside(x)) + 4;
eqns = [a + b*x == 1, a - b == 2];
S = solve(eqns, [x y])
% S =
% 包含以下字段的 struct:
%
% x: -3/2
% y: 11/2
The piecewise function is divided into two sections, which is so complex, so this work must be encapsulated as a function to complete:
function pwFunc=piecewiseSym(x,waypoint,func,pfunc)
% @author : slandarer
gSign=[1,heaviside(x-waypoint)*2-1];
lSign=[heaviside(waypoint-x)*2-1,1];
inSign=floor((gSign+lSign)/2);
onSign=1-abs(gSign(2:end));
inFunc=inSign.*func;
onFunc=onSign.*pfunc;
pwFunc=simplify(sum(inFunc)+sum(onFunc));
end
Function Introduction
- x : Argument
- waypoint : Segmentation point of piecewise function
- func : Functions on each segment
- pfunc : The value at the segmentation point
example
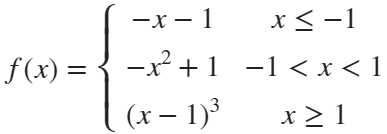
syms x
% x waypoint func pfunc
f=piecewiseSym(x,[-1,1],[-x-1,-x^2+1,(x-1)^3],[-x-1,(x-1)^3]);
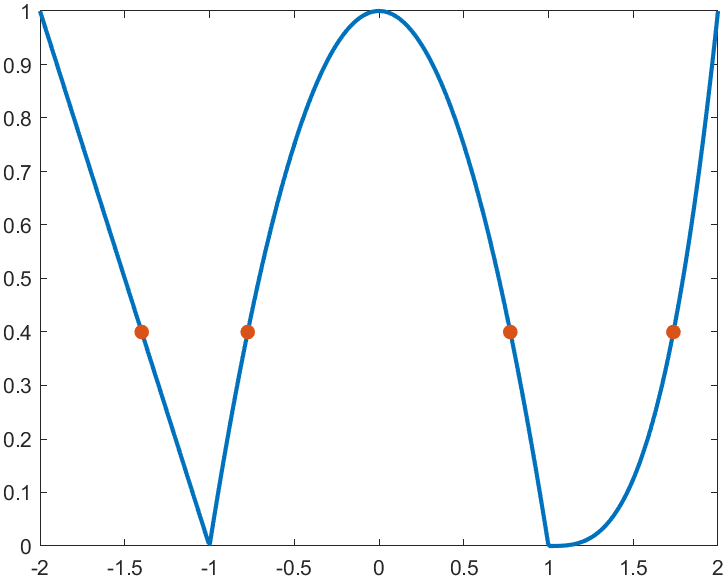
For example, find the analytical solution of the intersection point between the piecewise function and f=0.4 and plot it:
syms x
% x waypoint func pfunc
f=piecewiseSym(x,[-1,1],[-x-1,-x^2+1,(x-1)^3],[-x-1,(x-1)^3]);
% solve
S=solve(f==.4,x)
% S =
%
% -7/5
% (2^(1/3)*5^(2/3))/5 + 1
% -15^(1/2)/5
% 15^(1/2)/5
% draw
xx=linspace(-2,2,500);
f=matlabFunction(f);
yy=f(xx);
plot(xx,yy,'LineWidth',2);
hold on
scatter(double(S),.4.*ones(length(S),1),50,'filled')
precedent
syms x y
a=x+y;
b=piecewiseSym(x,0,[2,1],2);
eqns = [a + b*x == 1, a - b == 2];
S=solve(eqns,[x y])
% S =
% 包含以下字段的 struct:
%
% x: -3/2
% y: 11/2
A key aspect to masting MATLAB Graphics is getting a hang of the MATLAB Graphics Object Hierarchy which is essentially the structure of MATLAB figures that is used in the rendering pipeline. The base object is the Graphics Root (see groot) which contains the Figure. The Figure contains Axes or other containers such as a Tiled Chart Layout (see tiledlayout). Then these Axes can contain graphics primatives (the objects that contain data and get rendered) such as Lines or Patches.
Every graphics object has two important properties, the "Parent" and "Children" properties which can be used to access other objects in the tree. This can be very useful when trying to customize a pre-built chart (such as adding grid lines to both axes in an eye diagram chart) or when trying to access the axes of a non-current figure via a primative (so "gca" doesn't help out).
One last Tip and Trick with this is that you can declare graphics primatives without putting them on or creating an Axes by setting the first input argument to "gobjects(0)" which is an empty array of placeholder graphics objects. Then, when you have an Axes to plot the primitive on and are ready to render it, you can set the "Parent" of the object to your new Axes.
For Example:
l = line(gobjects(0), 1:10, 1:10);
...
...
...
l.Parent = gca;
Practicing navigating and exploring this tree will help propel your understanding of plotting in MATLAB.
Over at Reddit, a MATLAB user asked about when to use a script vs. a live script. How would you answer this?
Calling all students! New to MATLAB or need helpful resources? Check out our MATLAB GitHub for Students repository! Find MATLAB examples, videos, cheat sheets, and more!

Visit the repository here: MATLAB GitHub for Students
Starting with MATLAB can be daunting, but the right resources make all the difference. In my experience, the combination of MATLAB Onramp and Cody offers an engaging start.
MATLAB Onramp introduces you to MATLAB's basic features and workflows. Then practice your coding skill on Cody. Challenge yourself to solve 1 basic problem every day for a month! This consistent practice can significantly enhance your proficiency.
What other resources have helped you on your MATLAB journey? Share your recommendations and let's create a comprehensive learning path for beginners!
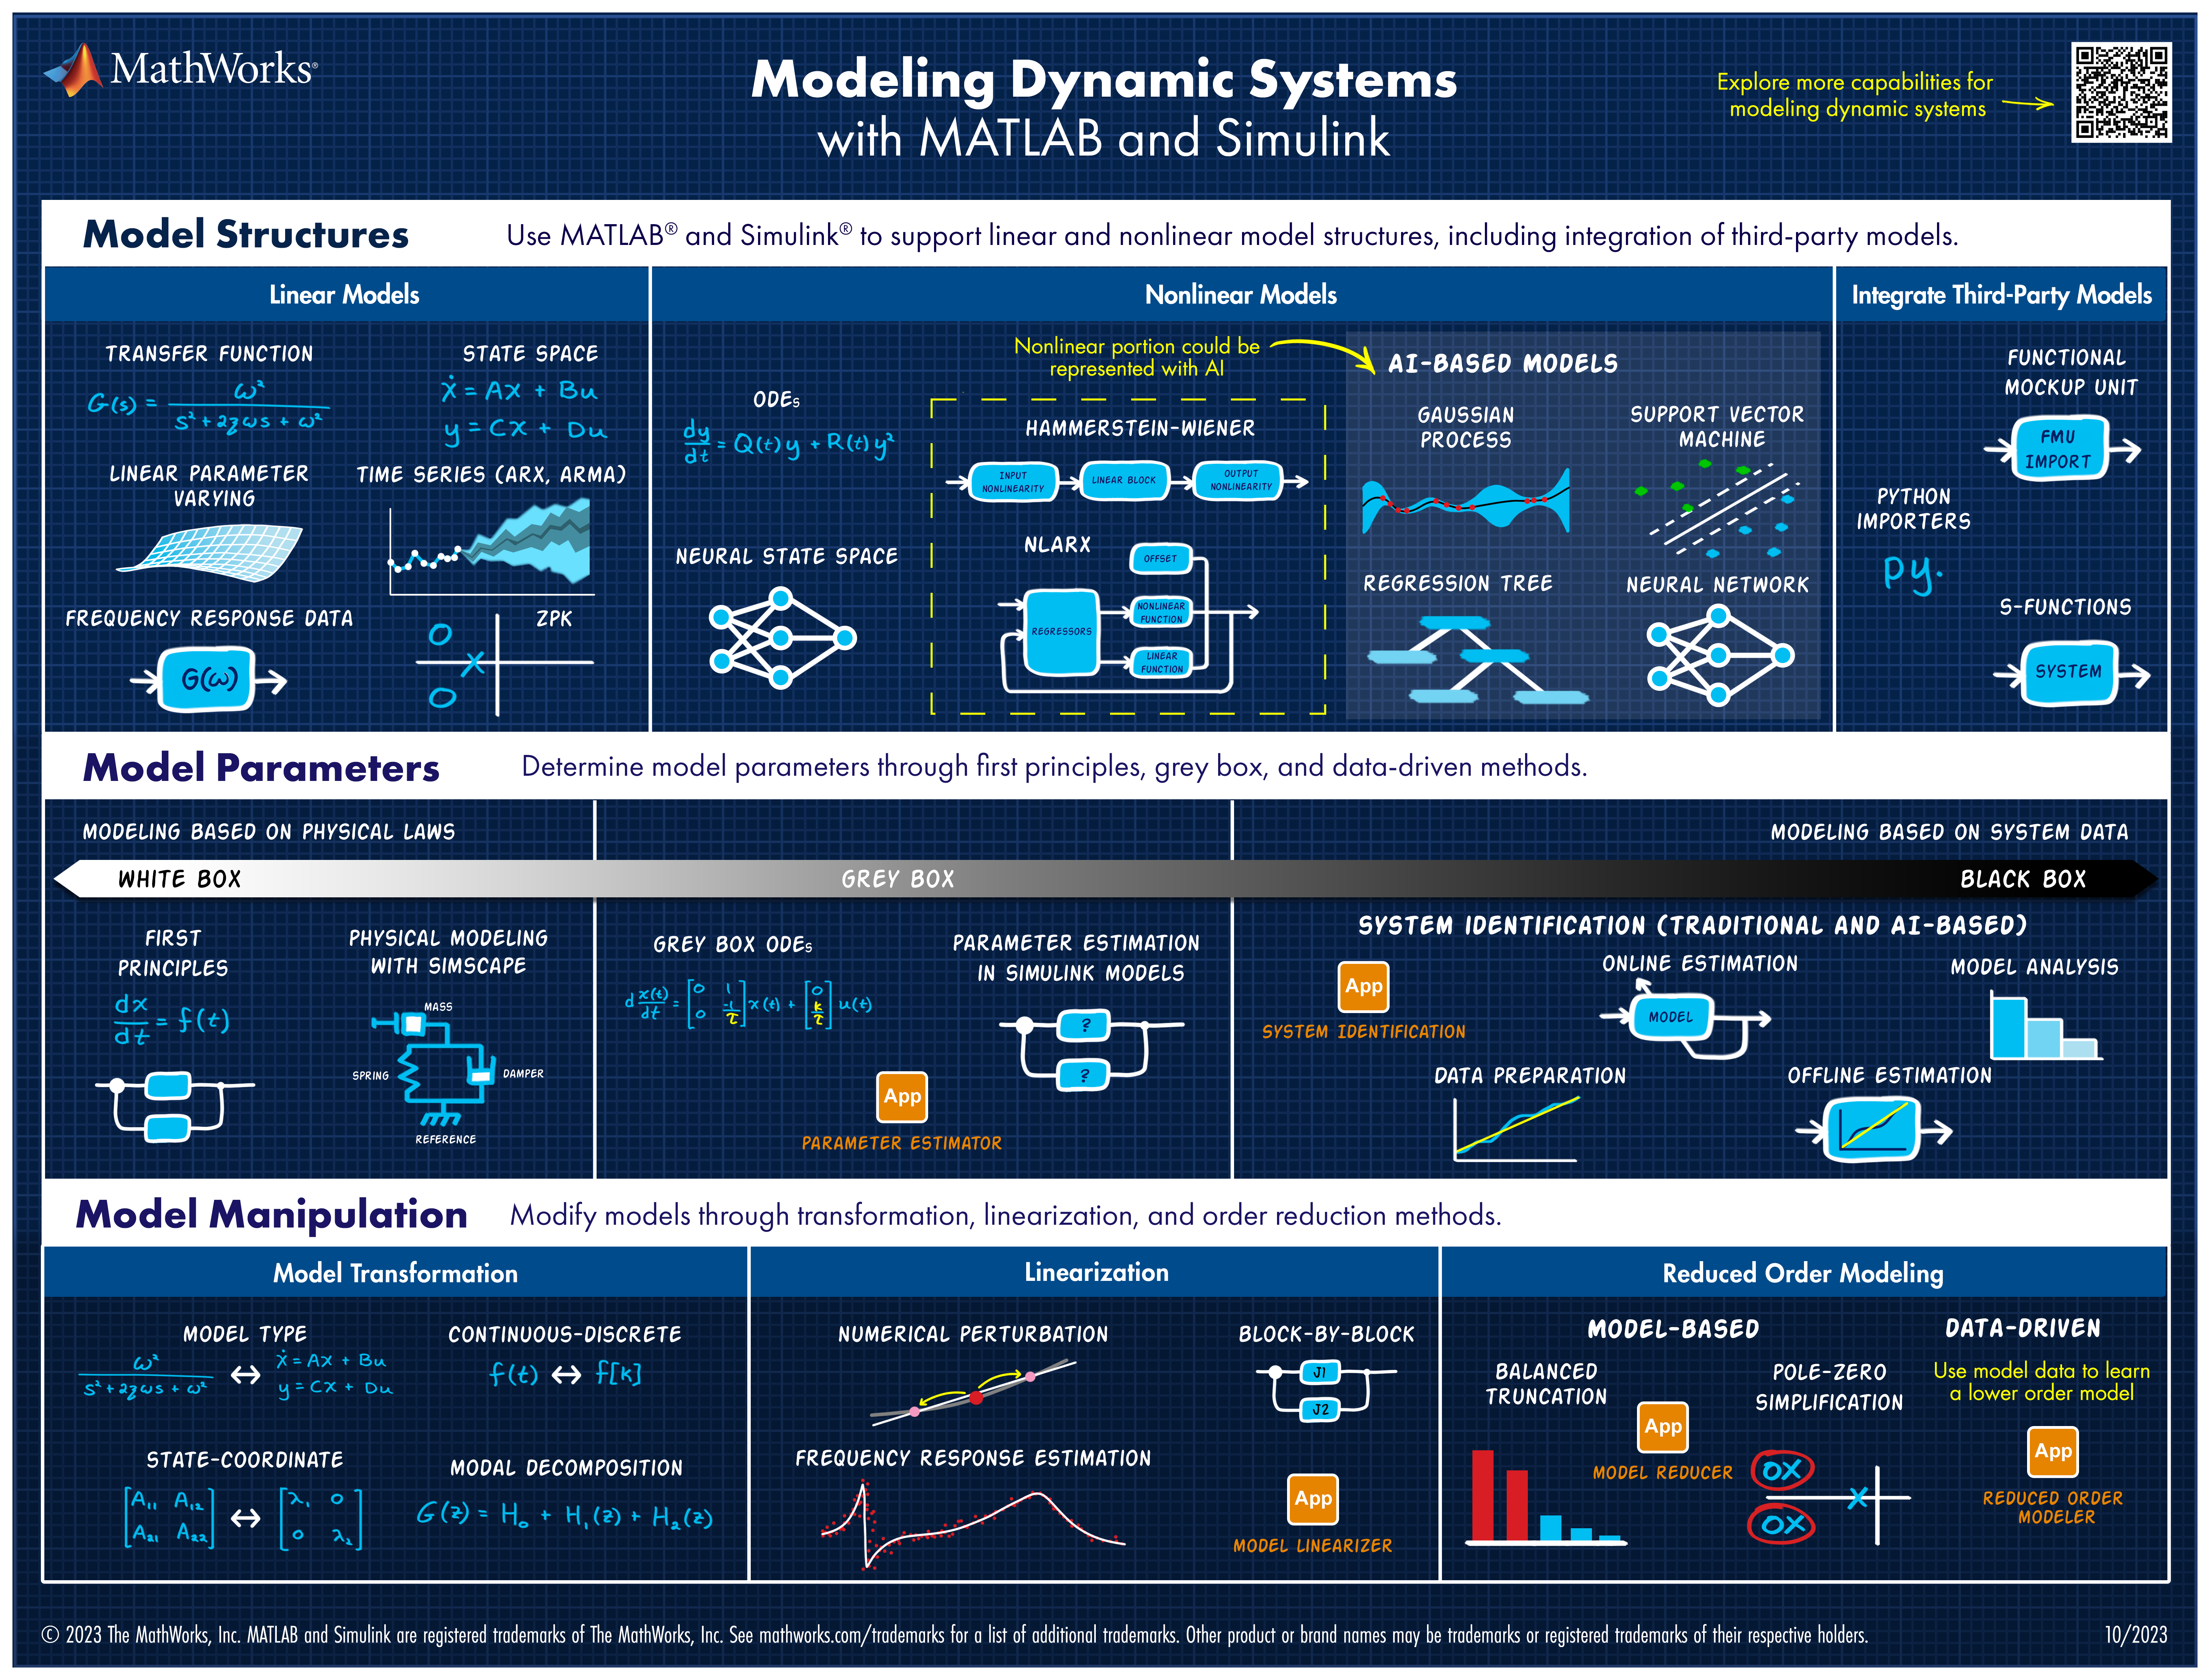
Explore all the capabilities for Modeling Dynamic Systems while keeping them handy with this Cheat Sheet - Download Now.
Here's a MATLAB class I wrote that leverages the MATLAB Central Interface for MATLAB toolbox, which in turn uses the publicy available Community API. Using this class, I've created a few Favorites that show me what's going on in MATLAB Central - without having to leave MATLAB 🙂
The class has a few convenient queries:
- Results for the last 7 days
- Results for the last 30 days
- Results for the current month
- Results for today
And supporting a bunch of different content scopes:
- All MATLAB Central
- MATLAB Answers
- Blogs
- Cody
- Contests
- File Exchange
- Exclude Answers content
The results are displayed in the command window (which worked best for me) and link to each post. Here's what that looks like for this command
>> CommunityFeed.thisMonth("app designer", CommunityFeed.Scope.ExcludeAnswers)
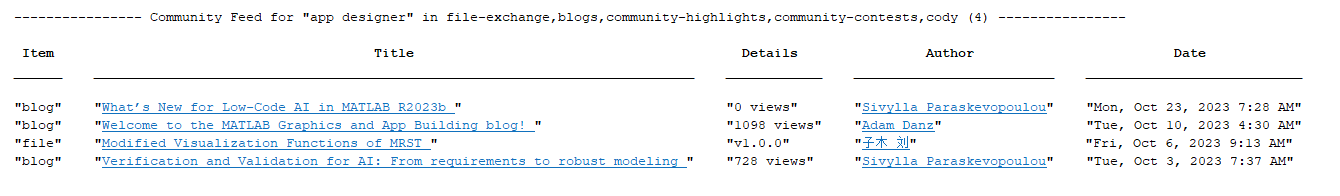
Let me know if you find this class useful and feel free to suggest changes.
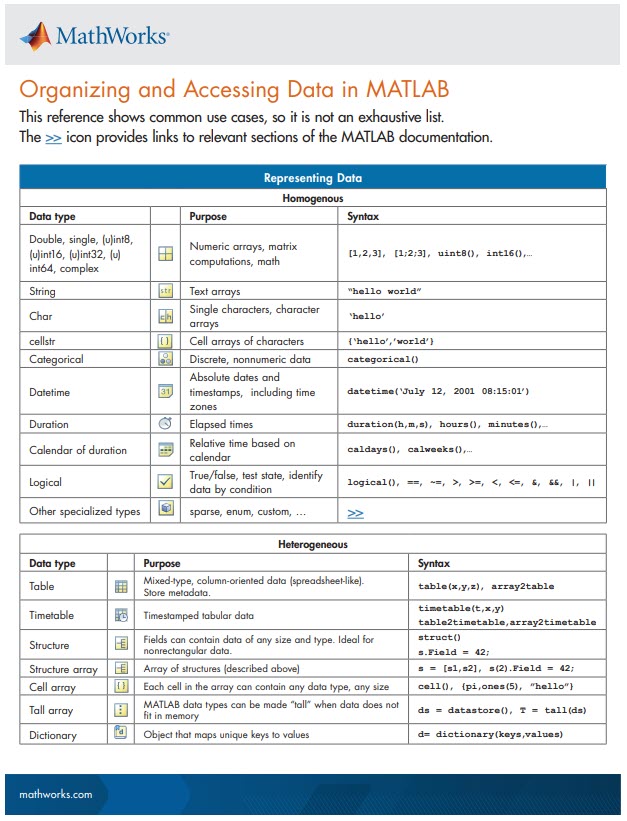
New Cheat Sheet Alert!
Level up your data organization and access skills in MATLAB with our latest cheat sheet! Download the full cheat sheet on MATLAB GitHub for Students here.
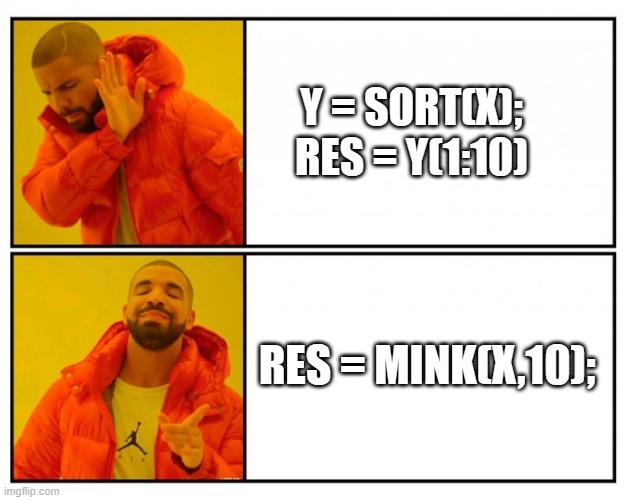
Imagine x is a large vector and you want the smallest 10 elements. How might you do it?
What is the best way to learn MATLAB at home without a tutor?
[INDEX]
--------------------------------------------------------------------------------------------------------------------------------------
[MOTIVATION]
Why should we use markups in the body of our questions?
The answer is a question: which of the two versions is more likely to be understood in a glimpse and has more chances to be answered by our readers?
.
< Consider the following question >
I have a vector of weights W=[10,20,30,50,23434,1,2.4,2] and a matrix A=rand(100,8) and I would like to find the row-wise weighted sum of A. I am proceeding in the following way: B=zeros(size(A)); for c=1:numel(W) B(:,c)=A(:,c)*W(c); end B=sum(B,2); Somehow I get huge numbers can you please help?
.
< Now, consider its formatted version >
I have a vector of weights W = [10,20,30,50,23434,1,2.4,2] and a matrix A = rand(100,8) and I would like to find the row-wise weighted sum of A.
I am proceeding in the following way:
B = zeros(size(A));
for c = 1:numel(W)
B(:,c) = A(:,c)*W(c);
end
B = sum(B,2);
Somehow I get huge numbers can you please help?
--------------------------------------------------------------------------------------------------------------------------------------
[AKNOWLEDGMENTS]
In alphabetical order by nickname, thanks for their suggestions to:
Walter Roberson
--------------------------------------------------------------------------------------------------------------------------------------
[LOG]
- 06 Aug 2011, 13:17 BST - created and added boldface.gif
- 06 Aug 2011, 14:59 BST - added italic.gif
- 06 Aug 2011, 18:58 BST - added index section
- 07 Aug 2011, 00:03 BST - added code.gif and tutorial series section
- 07 Aug 2011, 01:50 BST - added monospaced.gif, numlist.gif, bullist.gif and hyperlink.gif
- 13 Aug 2011, 14:27 BST - added motivation section
- 18 Aug 2011, 01:44 BST - added aknowledgments section and link to wish-list
--------------------------------------------------------------------------------------------------------------------------------------
[TUTORIAL Series]
Vote on Wish-list for MATLAB Answer sections my post if you think that a tutorial section on top of Answers could be useful.
I've now seen linear programming questions pop up on Answers recently, with some common failure modes for linprog that people seem not to understand.
One basic failure mode is an infeasible problem. What does this mean, and can it be resolved?
The most common failure mode seems to be a unbounded problem. What does this mean? How can it be avoided/solved/fixed? Is there some direction I can move where the objective obviously grows without bounds towards +/- inf?
Finally, I also see questions where someone wants the tool to produce all possible solutions.
A truly good exposition about linear programming would probably result in a complete course on the subject, and Aswers is limited in how much I can write (plus I'll only have a finite amount of energy to keep writing.) I'll try to answer each sub-question as separate answers, but if someone else would like to offer their own take, feel free to do so as an answer, since it has been many years for me since I learned linear programming.
Acerca de Tips & Tricks
Looking to improve your skills and efficiency? Reach your coding goals quickly and more easily with how-tos, tutorials, and shortcuts posted by our staff and community power users.Do you have your own tips and tricks to share? Help other community users with your insights and experience.
Moderadores
Seleccione un país/idioma
Seleccione un país/idioma para obtener contenido traducido, si está disponible, y ver eventos y ofertas de productos y servicios locales. Según su ubicación geográfica, recomendamos que seleccione: United States.
También puede seleccionar uno de estos países/idiomas:
América
- América Latina (Español)
- Canada (English)
- United States (English)
Europa
- Belgium (English)
- Denmark (English)
- Deutschland (Deutsch)
- España (Español)
- Finland (English)
- France (Français)
- Ireland (English)
- Italia (Italiano)
- Luxembourg (English)
- Netherlands (English)
- Norway (English)
- Österreich (Deutsch)
- Portugal (English)
- Sweden (English)
- Switzerland
- United Kingdom (English)