
Ahora está siguiendo esta publicación
- Verá actualizaciones en las notificaciones de contenido en seguimiento.
- Podrá recibir correos electrónicos, en función de las preferencias de comunicación que haya establecido.
Citar como
Adam Aitkenhead (2026). Plot a 3D array using patch (https://es.mathworks.com/matlabcentral/fileexchange/28497-plot-a-3d-array-using-patch), MATLAB Central File Exchange. Recuperado .
Agradecimientos
Inspiración para: Spectral Imaging Toolbox
Información general
- Versión (197 KB)
Compatibilidad con la versión de MATLAB
- Compatible con cualquier versión
Compatibilidad con las plataformas
- Windows
- macOS
- Linux
| Versión | Publicado | Notas de la versión | Action |
|---|---|---|---|
| 1.11.0 | The user can now define the lower and upper limits of the colorbar using the input parameter 'clim'. Also, the input flag 'sym' has been removed as this can be done using clim instead. |
||
| 1.9.0 | Provide the handle to the colorbar as an optional output. |
||
| 1.8.0 | Some minor code optimisations |
||
| 1.7.0 | Bugfix: Prevent a hole from appearing at the lowest values in a full colour plot. |
||
| 1.5.0 | The user can now specify the colour map for the display of a 3D numeric array. |
||
| 1.4.0 | Minor bugfix |
||
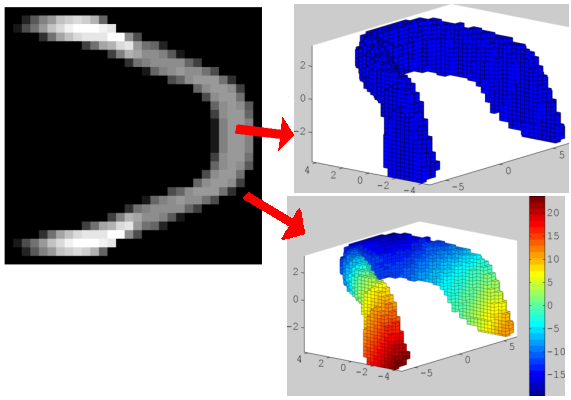
| 1.3.0 | Now enables a 3D numeric array to be plotted such that each facet corresponds to the value of each voxel in the array. |
||
| 1.2.0 | Added missing example.mat file |
||
| 1.1.0 | Improved documentation |
||
| 1.0.0 |

