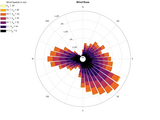
This function allows to create a Direction-intensity histogram, also known as "Wind Roses". This tool can be used for representing this kind of graphical representations.
It also returns the data represented in the graph into a data table (double array and cell array that can be directly exported to excel).
Inside the submission you will find the documentation with different examples so as to use the tool as needed.
Consider donating to support my work!
https://www.paypal.com/donate?hosted_button_id=D79DM35H7NPCW
by Daniel Pereira - daniel.pereira.valades@gmail.com
This function was featured in Ned Gulley's post in Matlab blogs on March 19, 2020, Nor’easters and Wind Roses.
https://blogs.mathworks.com/community/2020/03/19/noreasters-and-wind-roses/
Thank you very much Ned for including it in such an interesting article.
Thanks to all users providing feedback and support!
Please, keep giving feedback and suggestions.
Log:
2020/Mar/04
Added option to plot the windrose in the desired position (X,Y) in a plot. This is very useful combined with scalefactor.
Wind rose radius is now ALWAYS equal to the 'scalefactor' value, making easier to plot over the windrose and plotting several windroses on the same axes.
See attached PDF for more information.
2020/Mar/03
Corrected the issue with scale factor, which displayed wrong frequency values and wrong radial grid lines.
Changed the way in which labels are read. The order now should be 'North','East','South','West'.
Added options for grid line styles (color, line style and transparency/alpha) both for radial and circular grids.
Added option for variable adial divisions.
New angular-label options, now the function is able to support several labels in form of a cell array, which will be equally spaced.
cMap now allows a N×3 array of colors, which will be interpolated for the number of speeds shown (previously, the only option was to put these colors into 'colors' with a number if colors matching the 'nspeeds')
Added ability to change text, title and legend font through 'textfontname', 'titlefontname' and 'legendfontname' respectively
Added option to show frequency labels in the best place possible, with 'auto' option for 'freqlabelangle'
Added ability to plot zero and negative data
2015/Jun/22
Corrected histogram count inside function "PivotTableCount", which didn't consider always values greater than the max(vwinds) value.
2015/Mar/13
Added option to represent windrose inside given axes handle
2015/Feb/22
Corrected small errors.
Created extra documentation.
Corrected help dialog
2014/Jul/28
Figure has options to hide/show menubar and toolbar. Default is that menubar and toolbar are shown.
Default min_radius is 1/15 instead of 1/30.
User can specify speed bins 'colors' (necessary that nspeeds or vwinds are specified)
Order of the speeds can be modified: lowest speeds inside ('inverse',false) -default- or lowest speeds outside ('inverse',true)
Speed bins can be explicitly defined ('vwinds'), instead of just defining the number of the speed bins
Corrected bug when showing colorbar ('legendtype',2) with cmap other than jet
2014/Jul/14
First version
All options can now be passed to the function into a single cell array or a structure, where fieldnames are the property to be modified.
Daniel Pereira (2021). Wind Rose (https://www.mathworks.com/matlabcentral/fileexchange/47248-wind-rose), MATLAB Central File Exchange. Retrieved .
Inspired by: Wind_rose
Find the treasures in MATLAB Central and discover how the community can help you!
Start Hunting!Create scripts with code, output, and formatted text in a single executable document.
Really nice visualization tool. Thanks a lot!
The speed vector in the example fires/scripts contain negative values!!!!! A speed cannot be negative, specially when you are providing the direction!!
This is very useful and beautiful work. However, I want to add a calm factor in my frequency bins. I.e instead of starting from 0% I want to display frequencies in the rose plot that are > calm% (usually 0.5% calm). This is to remove any invalid data in the plot from inaccurate wind meters when faced with stale winds. Is there any easy way to do that in your package? I haven't found anything related to that in the documentation. Thank you.
My Matlab Can't recognize the function WindRose and WindRandomDistrib.What should I do?
it doesnt recognise windrose what should i do?
This package is really helpful. It is easy to use and modify if necessary. I recommend.
How can you change the fontsize of the labels? They are so small relative the big windrose that is created
Very nice! I have one question though - how do I add a legend label if I choose the colorbar legend type. It seems LabLegend only works with the box type. Thank you!
wonderful!!
Excellent!
Does anyone have tips on labeling the circles with the frequency of wind with percentages like most wind roses?
Really a detailed documentation
I got it. I've realized, reading the documentation, I needed to specify my reference anglees. I thought the function took the north 0º and the east 90º by default. Now it works properly. Thank you for the job.
Hi everyone,
Thanks Daniel for the code. I'm making a couple of wind roses with your function. Instead of using the intensity of the wind, I'm using the significant wave height (Hs or Hm0). I've compared the results with an official wave channel and the graphs aren't iqual, they don't even look similar. I think there's an error with the directions. I have analyzed the data I entered in the function and the result don't make sense. I've been trying to fix it but, unluckily, I don't have enough experience working with matlab. Could you check it?
Apart from this, the graph is very clear and attractive.
Thanks.
Updates to solve most of the questions posted since 2015:
1) Subplots: See the PDF documentation, page 42. Use 'axes',axeshandle. This has been there since third version I uploaded.
2) Scale factor error, both in labelling and final figure scaling. Please recheck with the latest version. These issues were fixed in 2020 versions.
3) Using any number of direction labels (usually 8 or 16): See the PDF documentation pages 37-39. 'labels',{'N','NE','E','SE','S','SW','W,'NW'}.
4) Directions. You can use whatever convention you need. Your data may represent the direction it is coming from or going to, it is up tou you. Angles, by default use trigonometric convention, but you can set your reference using 'anglenorth',0,'angleeast',90 or any other. See the PDF documentation page 7.
5) Negative values. Negative values are allowed now, using 'zeroAndNegative',true. See the PDF documentation page 23.
6) Plotting the windrose in a specific position: See the PDF documentation pages 46 and 47.
7) Save image: This can be done with matlab commands. I reccomend using export_fig (https://www.mathworks.com/matlabcentral/fileexchange/23629-export_fig/)
8) Radial divisions: Radial divisions can be changed to whatever number or format. Use 'radialGridNumber' (page 19 of the documentation) or change the style of the division grid (page 40 and 41 of the documentation).
Pending tasks: Absolute and normalized frequencies.
In oder to remove grids, use the following option:
'grdicolor','none'
If you want the maximum frequency circle to appear, use:
'gridalpha',0
(gridalpha does not apply to the external circle).
Thank for the update.
I would like to know how to turn off the axis in the wind rose plot.I am looking for just the colored figure with no grids and no axis.It would be great if someone could help on this.
Thanks
Hi everyone.
Thank you for all the feedback. I haven't been able to develop many of the improvements required during long time, but I finally managed to publish this version, which contains extra features, rather than error correction.
I will try to fix some of the remaining errors and add some feature like the possibility of plotting multiple wind roses at different positions in the same axes.
In case of doubt, check the documentation (PDF) provided algon with the code. It solves many of the frequently asked questions, such as the subplot issues!
hi everyone
I would like to plot multiple wind roses in single plot at different x and y positions.
Someone help me
Thanks
Thanks, daniel for code
I have some problem with labels can I change the label in windrose become 16 direction like (N, NNW, NW, WNW, W, etc)
Very good code! Thanks for that! I am only having trouble finding how can I use subplots with this function... Anyone knows how to do it? Thanks in advance!
Hola , necesito ayuda, no puedo guardar la imagen con una variable dentro.que hago??
Hi
Is it possible to plot 2 wind roses with subplot using this function?
There is something wrong with 'scalefactor'. When 'scalefactor' is not 1, the frequence is wrong.
Be careful !
This code is great, 100% of the people I read complaining in the reviews should simply READ the pdf document that the author published. Gracias, Daniel.
Works flawlessly, thank you very much!
Hi! Currently the windrose has 12 angular subdivisions (ie one angle every 30degrees). I actually want to show N, NW, W, SW, S, SE, E, NE (8 directions).
How can I do this?
Thanks!
Hi Daniel,
thanks so much for your function. I only have one question: In my windspeed colorbar i would like to force one color for every 0.5m/s. Currently all you can do is set a number of speeds in the option nspeeds. How can i set a step instead of a number of speeds?
thanks!
hello, I am new to this Matlab, so it quite hard for me to master the script. I tried to run the script with my own data but it seems that it has problem shown as below:
Error using xlsread (line 247)
Worksheet 'Data' not found.
Error in ExcelImportExport (line 20)
[data] = xlsread(ExcelName,'Data');
Can anyone help me, because this I have to used this script to complete my degree final year project. Thank you very much..
when u use the scalefactor function the frequency label will goes wrong,one could to annotation the ’scalefactor‘ from line 320 to 348,and just stay with the two lines
xlim(axs,[-radiusmax radiusmax]/scalefactor);
ylim(axs,[-radiusmax radiusmax]/scalefactor);
so one could use the scalefactor function...........wish to save someones time..
Lovely. Great work!
Thank you for the function! However, may I seek your assistance in enlarging the figure window? I tried to call out the figure and enlarge it using set(gcbo) but to no avail...
Thanks for the function! One bug I found is that if I use scalefactor, the patches do not scale accordingly.
Thanks for the code and the tutorial!
Thanks for this!
if anyone else is looking for a way to change the font size of the frequency labels and the cardinal points go into the code and add a variable to the functions FrequecyLabels and CardinalLabels (called on line 346 and 347 written on lines 438,444,448:451 just add 'FontSize', 11 to the text line (or what ever size you want)
Many thanks friend!
Congratulations on your incredible work !!
thanks man really saved my life
Thanks for sharing. Nice
This is an excellent tool. One quick question... when seeking to compare wind roses of two different time periods (say a 3 month period vs. a 12 month one), the fact frequency is in percent for the rose prevents proper comparison. Is it easy to tweak so roses can be created in absolute frequencies too?
Worked just great with my data. Easy to figure out through the excellent documentation.
It's a great Job! I'm just having problems with these codes because I want to plot just the negative values of temperature stability according to the wind direction. And it isn't working. Could you help me?
Close to 5 stars - it looks like your plots are flipped and rotated from your data. Was able to get the graph to looking right by doing projecting mod(-Direction - 270, 360).
Excellent Function an exceptional documentation.
EXCELLENT Documentation. Easy to read which makes a very easy and useful tool. Thank you for providing any mod I may need!
Thankssssss Daniel Pereira <3
Excellen tool! The meteological representation is possible if you set the options "anglenorth" in zero and angleeast in 90. Thank you Daniel!
Excellent tool!
Hello, could someone help me, please, how this code plot wind direction? Is it the mathematical vector or the meteorological winddirection (flags)? I suppose these are the vectors but I am not sure. Thank you in advance for your help!!
A great help. Nice function. Thks.
Excellent code! I wanted to verify that this represents the meteorological convention right (ie, direction where the wind is coming from)? But the comment from Tony Fong is making me think that maybe the plotting needs to be shifted by 90 degrees clockwise. Did I interpret his question correctly though? Thanks!
Note, there is a bug in this. The North, South, East and West positions are incorrect. Matlab has its standard axis with zero in the 3 o'clock position and the axis run anit clock wise. For the rose as this plots they would need to be adjusted to be at the 12 o'clock and running clock wise.
As a result this functions lettered axis are 'positionally' wrong and going the wrong direction.
Great otherwise.
Nice job!
Very nice function. I have managed to set the font size for the title and the legend, but want to set it for the cardinal points and the frequency marks as well, however I can't find the relevant item in the returned figure handle - can anyone post me in the right direction please? Thanks.
This is an awesome tool! Super useful! VERY well documented and very flexible. The one thing that I would LOVE to do is plot a single wind vector on top of the wind rose. For example, if I make a wind rose for a site based on data over 10 years, and then want to demonstrate how a particular event compares, I would like to have an line out from the center in that direction with something (length/color/weight/?) to represent wind speed of that particular event/time.
Regardless, thanks for building such an awesome tool, sincerely!
素敵です!ありがとうございます
我需要添加出8个方位(8方向,N,NE,E,SE,S),请问需要更改那些地方?
An excellent tool. Just a detail, on my rose there seems to be a thin blue line parallel to the ENE direction. I can't seem to make it disappear.... Is there any option for it? It does not ruin the graph, it is just a little bit annoying
Nice works, Tks.
How would I convert to cm/s?
Great function!
Thank you.
I just added two things in order to have a particular graph, but it is perfect!!
Thanks
Thanks
شكرا لكم
شكرا لكم
Very cool function. I would suggest another attribute is rounding the numbers of the legend.
COOL
Super nice function!!
I would like to use this function to plot fluxes and wind directions, but the fluxes have negative values.
Is there a smart/easy way to get the negative values on, just with other colors?
Thank you , it was very helpful.
however, my using for this function show me two errors i think u can update
1-there is a little problem, when you associate the legendtype '1' with Label Legend. The laster doesn't show up after execute the function.
2-The FreqLabel Angle is not updated if you change the reference.
But still, it was very helpful for me, thank you again.
Any idea why the Figure window might be coming up blank?
I want to create a figure with a few subplots of wind roses comparing wind profiles from different sites. I therefore only need to show the legend for one of the subplots and want to hide it for the others since it would be redundant and consume space. How do I do that? Thanks!
Very useful code, thank you! Can you provide an example where 2 or more wind roses are plotted in the same figure? so the center of the first to be located at (x1,y1) and the second at (x2,y2). I tried to handle the axes but without success.
excellent! very helpful :). Thank you
Excellent contribution. This completely solved my needing a wind rose function. The options (shown in detail in the documentation mfile) allow you to customize the rose how you like it and fit my needs.
Far too complicated.
Daniel Thank very much for your contribution, what a nice tool! I have looked for a tool like this for a long time... and finally I found it!!
The examples and good documentation make it very user friendly, I am sure I will use it a lot for wave roses.
Nice function. By the way, could it plot wind rose with normalized intensities?
Thanks
A tour de force! So many options and all explained or illustrated with examples. One small tweak to reduce a bit of clutter would be to have the '%' label, as distinct from the numerals, only appearing at the outermost freqency ring.
Hello everyone!
I've included for this submission three important things:
1) Creating Wind roses in subplot or existing axes.
2) Included a script to show how to import/export from/to Excel.
3) Updated documentation explaining all the capabilities.
Please, refer to the documentation in order to make use of this tool. In case you need help, do not hesitate to contact me at daniel.pereira.valades@gmail.com.
How to input excel sheet into this program to get the output.
Cool code!
Is it possible to plot the wind rose into existing axes?
Cheers
S
i like using this function for image file, how to parameter it??
please help!!!
Very comprehensive. An extra feature I'd like - but maybe I've missed it - is to use a vector to set the edges of bins, rather than relying on a scalar for nbins.
It's a great contribution: I'm using it a lot currently.
Thanks for a great function.
However, I think there might be a bug. I'm not sure as I haven't had time to investigate it properly but it seems to me that an incorrect subset wind directions is selected when removing calm winds.
At row nr. 176:
speed = speed(speed>0);
dir = dir(speed>0);
should be:
dir = dir(speed>0);
speed = speed(speed>0);
Hi, great program it is very helpful!!!! But I have a problem the percentages don't show up in the figure how can I fix it ?
Is there an easy way to have the wind roses on subplots? If I want to compare wind roses at different times of day or at different stations, say. thanks. It's a nice program.
Greetings,
I get the errors below in matlab, I tried fixing it multiple of times. Please help me. I need the labels.
Warning: Unable to interpret LaTeX string "W_S \geq 30"
Warning: Unable to interpret LaTeX string "25 \leq W_S < 30"
Warning: Unable to interpret LaTeX string "20 \leq W_S < 25"
Warning: Unable to interpret LaTeX string "15 \leq W_S < 20"
Warning: Unable to interpret LaTeX string "10 \leq W_S < 15"
Warning: Unable to interpret LaTeX string "5 \leq W_S < 10"
Warning: Unable to interpret LaTeX string "0 \leq W_S < 5"
Warning: Unable to interpret LaTeX string "0.8%"
Warning: Unable to interpret LaTeX string "1.6%"
Warning: Unable to interpret LaTeX string "2.4%"
Warning: Unable to interpret LaTeX string "3.2%"
Warning: Unable to interpret LaTeX string "4%"
Warning: Unable to interpret LaTeX string "0%"
Thank you Frank, I'm glad it was useful for you.
Daniel: Excellent contribution, and well documented. It was a breeze to adapt your submission to my customized use (testing GPS Compass Headings).
Update released including NOTC, Amin and Danny's comments.
Thank you everyone for commenting.
NOTC, Amin,
to save the plot you can use
print('-dpng','EindRose.png','-painters');
or
imwrite(frame2im(getframe(gcf)),'WindRose.png');
If you want the toolbar and the menubar to appear, just look for this code:
'menubar','none'
and
'toolbar','none'
and remove it.
I am working in a new version, so you can specify if you want to show menubar and toolbar (defalut will be on).
Thanks Danny.
I will add this feature for a future release.
Meanwhile, you can change the colors used adding your colormap matrix manually on line 266, replacing
color = interp1(linspace(1,length(vwinds),256),color,1:length(vwinds));
With the colormap matrix you want.
Top class bit of code. One small addition I found was very useful: allowing the user to specify a vector for the axis for the speeds (ie colours) instead of just a number. Highly structured and well-documented code.
how to save the plot?
Although I have a problem with saving the figure. Why isn't it just in normal figure window?
Thank you Josué and Warwick!
If any user needs any other functionality that is not currently included, do no heistate to ask me to implement it.
Very good function: clear, simple to use, great design. No problems with the angle definition (trigonometric or meteorological)