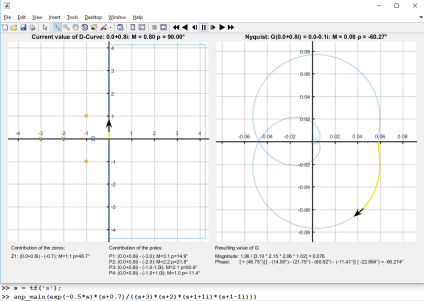
ANP: Animated Nyquist Plot
Create a customizable nyquist plot that displays pole/zero contributions.

Ahora está siguiendo esta publicación
- Verá actualizaciones en las notificaciones de contenido en seguimiento.
- Podrá recibir correos electrónicos, en función de las preferencias de comunicación que haya establecido.
Citar como
Stefan Rickli (2026). ANP: Animated Nyquist Plot (https://github.com/StefanRickli/anp), GitHub. Recuperado .
Agradecimientos
Inspirado por: GUI for Understanding Nyquist Plots
Inspiración para: Plot Nyquist Didactic
Información general
- Versión (84,4 KB)
-
 Ver licencia en GitHub
Compatibilidad con la versión de MATLAB
- Compatible con cualquier versión
Compatibilidad con las plataformas
- Windows
- macOS
- Linux
| Versión | Publicado | Notas de la versión | Action |
|---|---|---|---|
| 6.0.1 | Bugfix:
|
Para consultar o notificar algún problema sobre este complemento de GitHub, visite el repositorio de GitHub.
Para consultar o notificar algún problema sobre este complemento de GitHub, visite el repositorio de GitHub.

