densityScatterChart
Versión 1.1 (1,53 MB) por
Dave B
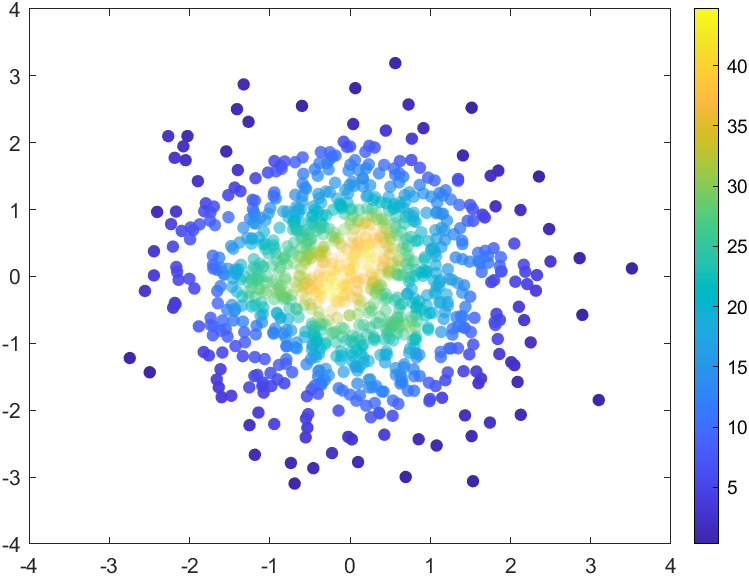
A scatter where the color (and/or transparency) of the markers indicates the density of points.
densityScatterChart
Version: 1.1
Density Scatter Chart is a scatter where the color (and/or transparency) of the markers indicates the density of points.
How to use:
x=randn(1000,1);
y=randn(1000,1)
densityScatterChart(x,y);   % create a chart where color varies with density

%% You can set properties using name value pairs
% Create a chart where transparency varies with density:
densityScatterChart(x, y, 'UseColor', false, 'UseAlpha', true);

% Specify a title:
densityScatterChart(x, y, "Title", "My density scatter chart");

%% You can also set properties after making the chart:
d=densityScatterChart(x, y);

% Make a steeper density view
d.DensityExponent = 2;

% Use alpha, but make it a subtle effect by using a small range:
d.AlphaRange = [.2 .8];
Citar como
Dave B (2024). densityScatterChart (https://github.com/MATLAB-Graphics-and-App-Building/densityScatterChart/releases/tag/v1.1), GitHub. Recuperado .
Compatibilidad con la versión de MATLAB
Se creó con
R2021a
Compatible con cualquier versión desde R2020b
Compatibilidad con las plataformas
Windows macOS LinuxCategorías
- MATLAB > Graphics > 2-D and 3-D Plots > Discrete Data Plots >
- MATLAB > Graphics > Graphics Objects > Developing Chart Classes >
Más información sobre Discrete Data Plots en Help Center y MATLAB Answers.
Etiquetas
Community Treasure Hunt
Find the treasures in MATLAB Central and discover how the community can help you!
Start Hunting!Descubra Live Editor
Cree scripts con código, salida y texto formateado en un documento ejecutable.
| Versión | Publicado | Notas de la versión | |
|---|---|---|---|
| 1.1 | See release notes for this release on GitHub: https://github.com/MATLAB-Graphics-and-App-Building/densityScatterChart/releases/tag/v1.1 |
||
| 1.0 |
Para consultar o notificar algún problema sobre este complemento de GitHub, visite el repositorio de GitHub.
Para consultar o notificar algún problema sobre este complemento de GitHub, visite el repositorio de GitHub.


