How to change parula with jet?
<http://www.mathworks.com/matlabcentral/answers/246461-how-can-i-get-the-default-colormap-to-be-jet-in-matlab-2014b>
más de 10 años hace | 0
Publicado
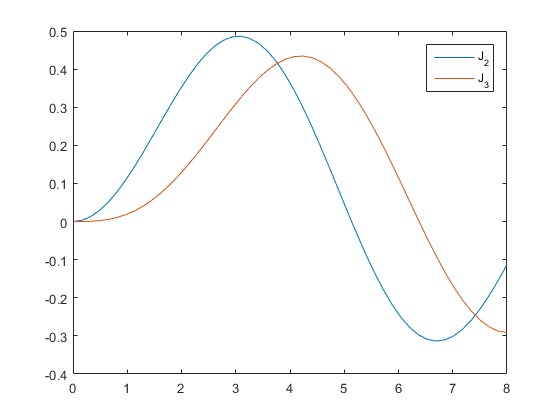
Fill Between
Fill BetweenOne question I'm often asked is how to fill the area between two plotted curves. It is possible to do this, but...
más de 10 años hace
Screen (2D) projection of 3D plot
I talked about the theory behind this in <http://blogs.mathworks.com/graphics/2015/09/28/homogeneous-coordinates/ this recent po...
más de 10 años hace | 5
| aceptada
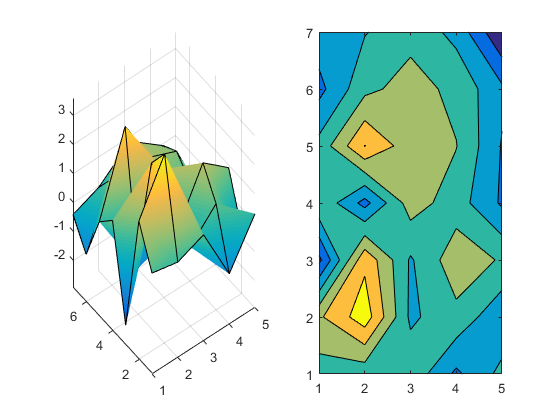
How to make contour plot of given matrices
It's going to look something like this: nrows = length(f); ncols = 150; x = linspace(-10,10,ncols) y = linspace(0,...
más de 10 años hace | 1
How to overlay pcolour figures?
The pcolor function simply creates a surface object with color but no Z. You can set the FaceAlpha property on that to make it t...
más de 10 años hace | 0
Is there a way to control distortion in Matlab's 3D viewer?
I think that the CameraViewAngle property is what you're looking for. You mentioned it as one of the things you know how to adju...
más de 10 años hace | 1
Questions about setting the aspect ratio when rotating an object
What 'axis vis3d' does is freeze the aspect ratios at their current values. This is useful if you're going to rotate the object,...
más de 10 años hace | 0
| aceptada
Matlab 2-D color plot without imagesc
What you have is 2D scatter data with colors. Let's make up a simple example and look at your options: rng default x = r...
más de 10 años hace | 1
How to use bar plot without outlines?
Either EdgeColor or LineStyle. You might also want to set BarWidth: bar(rand(1,10),'EdgeColor','none','BarWidth',1)
casi 11 años hace | 3
| aceptada
3-D geometric transformation of a matrix of 3-D points
Probably the simplest is something like this: mat = makehgtform('axisrotate',[1 1 1],pi/5, 'translate',[1 2 3]); newpts ...
casi 11 años hace | 0
| aceptada
how can i get the default colormap to be JET in matlab 2014b?
There are two different things getting confused here. There's the Colormap. The default for that changed from jet to parula. ...
casi 11 años hace | 3
| aceptada
Why makehgtform creates 4x4 matrices? Why not 3x3?
Actually, I just put a post on the MATLAB Graphics blog which tells the story of why they're 4x4 matrices. You can check it out ...
casi 11 años hace | 3
| aceptada
How to set scatter plot colors in order to adjust all plots to a same reference?
I'm not sure I'm following. Let's take a simple, concrete example: rng default nval = 100; cmin = 8e-5; cmax = 8e-...
casi 11 años hace | 2
| aceptada
How can I plot a figure with two y axis in my GUI
Why doesn't it work? Do you get an error message when you do: plotyy(handles.axest, v7k,v9k,v7k,v2k) If so, what error m...
casi 11 años hace | 0
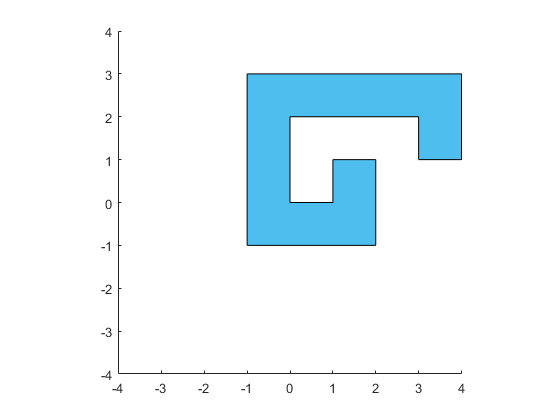
Creating a 2D moving object
Sure, here's a simple example. First we create an object. I'm using patch because it's good at all sorts of 2D shapes, and I...
casi 11 años hace | 8
| aceptada
How to apply a transformation with makehgtform()?
I just put <http://blogs.mathworks.com/graphics/2015/09/28/homogeneous-coordinates/ a post up on the MATLAB graphics blog> that ...
casi 11 años hace | 1
XTick labels and Stacking in bar plot
In the first (grouped) case, you're probably going to be more successful if you have the two series share a common XData. That'd...
casi 11 años hace | 4
Plotting a 3D matrix on a normal 2D plot
The <http://www.mathworks.com/help/matlab/ref/animatedline.html animatedline function> is usually a good tool for this type of p...
casi 11 años hace | 1
| aceptada
Publicado
Homogeneous Coordinates
Homogeneous CoordinatesIn my recent posts about tiling polygons (link1, link2), you might have noticed that I used a...
casi 11 años hace
Bar graph - how to add transparency in Matlab 2014b
In R2014b you'd have to create the bars yourself using fill or patch, which is how bar was implemented in earlier releases. H...
casi 11 años hace | 0
| aceptada
Publicado
What is a Contour?
What is a Contour?Last year we explored how surfaces perform interpolation. Today we're going to take a look at some closely...
casi 11 años hace
imagesc() Y Axis Log Scale Not Working (Help!)
The way images work is that they only have coordinates for the corners. These get transformed and then the graphics hardware fil...
casi 11 años hace | 3
| aceptada
assigning a color to the same value when ploting multiple matrices
You probably want the <http://www.mathworks.com/help/matlab/ref/caxis.html caxis function>. This will let you set the top and bo...
casi 11 años hace | 0
How do I guage plotting speed when using the plot function?
Measuring graphics performance is kind of a rich topic. There are a couple of different variables which are important to conside...
casi 11 años hace | 0
| aceptada
Legend entries all same color in Matlab 2015b
That sounds like <http://www.mathworks.com/support/bugreports/1283854 bug 1283854>. There's a patch and some workarounds at that...
casi 11 años hace | 2
| aceptada
GUI creation script has "matlab.graphics.GraphicsPlaceholder/set" error
Your code's a bit garbled, but what that error message is trying to say is that when it encounters this line: set(h.eqdata(...
casi 11 años hace | 0
| aceptada
how to plot plane wing surface of an aircraft using two ferguson curve in MATLAB?
You don't seem to have attached an image, but ... I believe that Ferguson curves were an early variation on cubic Bézier curv...
casi 11 años hace | 0
How to add real time graph in simulink 3D animation?
<http://blogs.mathworks.com/graphics/2014/10/21/double_pendulum/ This blog post> illustrates one way to use MATLAB Graphics from...
casi 11 años hace | 1
trisurf handles related.....
The first question is how large your "huge" dataset is. It is possible that you've given it so much data that it's choking the g...
casi 11 años hace | 2
Pixel is a 2D or 3D? please answer me. thanks
I think that the best answer for what a pixel "is" is Alvy Ray Smith's <http://alvyray.com/Memos/CG/Microsoft/6_pixel.pdf A Pixe...
casi 11 años hace | 2