Measure Impact of Sub-THz Hardware Impairments on 6G Waveforms
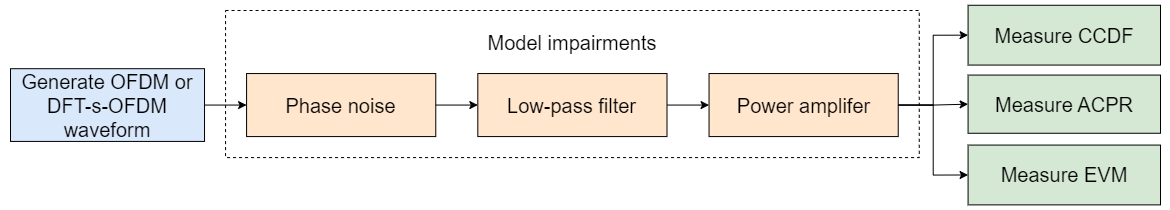
This example shows how to explore the impact of hardware impairments at sub-THz frequencies on a candidate 6G waveform. The hardware impairments are: phase noise, power amplifier (PA) nonlinearity, and a filter to limit spectral emissions outside of the channel bandwidth. The example measures the complementary cumulative distribution function (CCDF) of the waveform power, adjacent channel power ratio (ACPR) and error vector magnitude (EVM) of the impaired waveform to demonstrate the impact of impairments.
Set System Parameters
This example models a pre-6G OFDM or DFT-s-OFDM (Discrete Fourier Transform spread Orthogonal Frequency Division Multiplexing) waveform with system parameters defined in Hexa-X Deliverable D2.3 Table 5-7 [1] to investigate the impact of hardware impairments on candidate 6G waveforms. DFT-s-OFDM is a technique used in the uplink of 5G NR to spread symbols in the frequency domain to reduce the peak to average power ratio (PAPR) compared to OFDM.
carrierFrequency =140; % GHz bandwidth =
2160; % MHz - transmission bandwidth and guardbands subcarrierSpacing =
3840; % kHz waveform =
"OFDM"; % Waveform modulation
Set the bandwidth occupancy. This is the ratio between the transmission bandwidth and channel bandwidth. A lower bandwidth occupancy increases the size of guardbands, reducing spectral emissions at the cost of reduced spectral efficiency.
bandwidthOccupancy =0.8; % Ratio of transmission bandwidth to channel bandwidth
Create a carrier configuration. Calculate the transmission bandwidth and required number of resource blocks (NSizeGrid) given the bandwidth occupancy.
carrier = pre6GCarrierConfig;
carrier.SubcarrierSpacing = subcarrierSpacing;
channelBandwidth = bandwidth*1e6; % Bandwidth of RBs and guard carriers in Hz
carrier.NSizeGrid = floor((channelBandwidth/(carrier.SubcarrierSpacing*1e3)*bandwidthOccupancy)/12); % 12 subcarriers per RB
transmissionBandwidth = carrier.SubcarrierSpacing*1e3*carrier.NSizeGrid*12; % Bandwidth of RBs in Hz
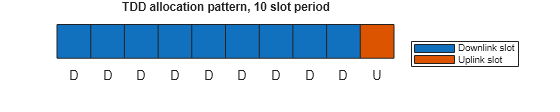
This example creates a time division duplex (TDD) waveform consisting of a pattern of downlink slots followed by uplink slots with a specified period. Set the length of the waveform and TDD parameters.
numSubframes =0.5; % Number of subframes to simulate tddConfig.TDDPeriod =
10; % TDD period in slots tddConfig.NumDownlinkSlots =
9; % Number of slots in TDD period containing PDSCH numSlots = numSubframes*carrier.SlotsPerSubframe; tddConfig.SlotAllocation = 0:tddConfig.NumDownlinkSlots-1; % Assume downlink slots at start of TDD period disp("Simulating "+numSlots+" slots")
Simulating 128 slots
visualizeTDDAllocation(tddConfig);
Configure a physical downlink shared channel (PDSCH) for full resource block (RB) allocation and enable the phase tracking reference signal (PT-RS).
pdsch = pre6GPDSCHConfig; pdsch.PRBSet = 0:(carrier.NSizeGrid-1); pdsch.Modulation ="16QAM"; pdsch.EnablePTRS =
true;
Generate Waveform
Set a factor by which to oversample the waveform to measure spectral emissions outside of the channel bandwidth. The example sets the FFT size such that it spans the specified oversampled channel bandwidth and is an integer multiple of 128 for a normal cyclic prefix length.
oversamplingFactor =3; % Multiple of the channel bandwidth nFFTWaveform = ceil((channelBandwidth/(carrier.SubcarrierSpacing*1e3))*oversamplingFactor/128)*128;
Create a waveform containing a PDSCH transmission, demodulation reference signal (DM-RS), and PT-RS in appropriate TDD slots. The example applies transform precoding if you set waveform to "DFT-s-OFDM". The DM-RS is not transform precoded.
[txWaveform,ofdmInfo] = hpre6GPDSCHWaveform(carrier,pdsch,numSubframes,Nfft=nFFTWaveform,TDDConfig=tddConfig,WaveformModulation=waveform);

% Normalize waveform to maximum amplitude for PA modeling
txWaveform = txWaveform/max(abs(txWaveform),[],"all");

% Prepend slot to the waveform to allow for filter delay
waveformLength = height(txWaveform);
slotLength = waveformLength/numSlots;
txWaveform = [txWaveform(end-slotLength+1:end,:); txWaveform];
Add Impairments
In this section, you model phase noise and power amplifier (PA) nonlinearity impairments, and apply a filter to limit spectral emissions outside of the channel bandwidth.
Phase Noise
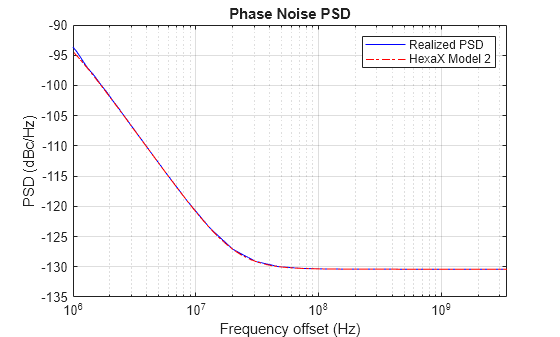
Introduce phase noise distortion. This example uses a phase noise model defined in Hexa-X Deliverable D2.3 Section 4.2.1.1, scaled to 140 GHz as specified in Hexa-X Deliverable D2.3 Table 5-7. This Hexa-X model is based on measurements of 20 GHz wideband RF synthesizer TI LMX2596. Set the minimum frequency offset the phase noise model uses to compute the phase noise spectrum mask. By default, this example uses a 1 MHz minimum frequency offset, therefore the phase noise level below 1 MHz does not match the Hexa-X model. Simulating with a lower minimum frequency offset will more accurately model the low frequency phase noise of the Hexa-X model but result in a longer time to design the phase noise filter.
impariredWaveform = txWaveform; enablePN =true; % Enable phase noise model if enablePN minimumFrequencyOffset =
1e6; % Hz mdl = "HexaX Model 2"; phaseNoise = hpre6GPhaseNoise(carrierFrequency*1e9,ofdmInfo.SampleRate, ... MinFrequencyOffset=minimumFrequencyOffset,Model=mdl, ... RandomStream="mt19937ar with seed"); visualize(phaseNoise); % Show phase noise PSD impariredWaveform = phaseNoise(impariredWaveform); % Apply phase noise model end
Low-Pass Filter
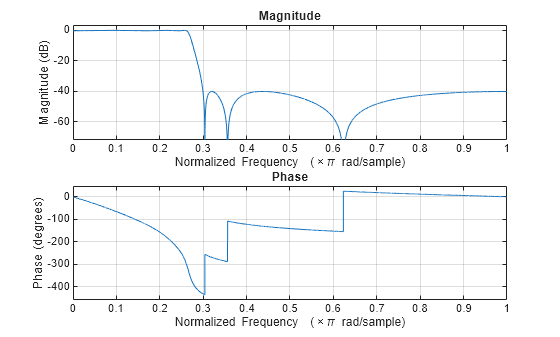
Filter the baseband waveform to limit emissions outside the channel bandwidth. If the current passband and stopband frequencies, PassbandFrequency and StopbandFrequency, result in high EVM values, use a wider filter by increasing PassbandFrequency and StopbandFrequency. To use a narrower filter, reduce PassbandFrequency and StopbandFrequency. You can also modify the PassbandRipple and the StopbandAttenuation.
enableLPF =true; % Enable low-pass filter if enableLPF % Create low-pass filter object LPF = dsp.LowpassFilter; LPF.SampleRate = ofdmInfo.SampleRate; LPF.FilterType = "IIR"; LPF.PassbandFrequency = (transmissionBandwidth + 24*carrier.SubcarrierSpacing*1e3)/2; LPF.StopbandFrequency = channelBandwidth/2; % TransmissionBandwidth and guards LPF.PassbandRipple = 0.2; LPF.StopbandAttenuation = 40; figure; freqz(LPF); % Plot the response of the low-pass filter % Filter the waveform impariredWaveform = LPF(impariredWaveform); release(LPF); end
Power Amplifier
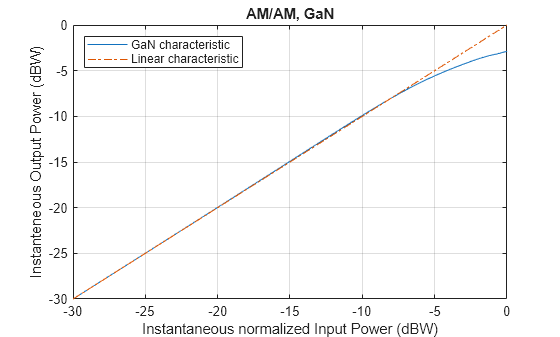
Apply a PA impairment model. This example applies a memoryless GaN PA model as described in Hexa-X Deliverable D2.3 Table 5-7 and Hexa-X Deliverable D2.2 Section 3.6.6.1 [2]. This model assumes the ACPR characteristic with respect to PA output power shift according to the expected downscaling of maximum PA output power when increasing frequency.
Set the model backoff to reduce the amplitude of the input signal and reduce distortion.
enablePA =true; % Enable power amplifier model if enablePA backoff =
6; % In dB impariredWaveform = db2mag(-backoff)*impariredWaveform; % Apply PA backoff visualizeAMAMCharacteristic(@paMemorylessGaN,"GaN"); impariredWaveform = paMemorylessGaN(impariredWaveform); end
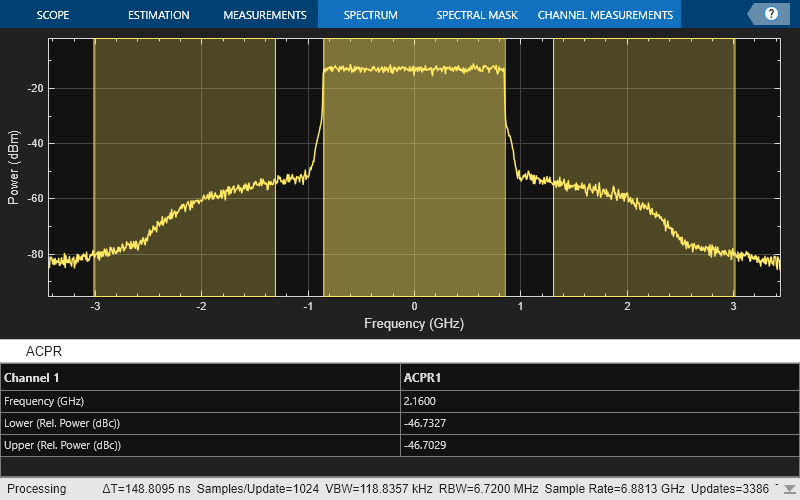
Measure ACPR
Measure the ACPR to study spectral regrowth caused by the nonlinear PA model.
measureACPR =true; if measureACPR % Calculate the number of adjacent channels which can be measured given % the sample rate numAdjacentChannels = floor((ofdmInfo.SampleRate/channelBandwidth-1)/2); if numAdjacentChannels>0 sa = spectrumAnalyzer; sa.SampleRate = ofdmInfo.SampleRate; sa.ChannelMeasurements.Type = "acpr"; sa.ChannelMeasurements.Enabled = true; sa.ChannelMeasurements.Span = transmissionBandwidth; sa.ChannelMeasurements.NumOffsets = numAdjacentChannels; sa.ChannelMeasurements.AdjacentBW = transmissionBandwidth; sa.ChannelMeasurements.ACPROffsets = (1:numAdjacentChannels)*channelBandwidth; sa(impariredWaveform); else warning("Sample rate too low to measure ACPR, increase oversamplingFactor") end end
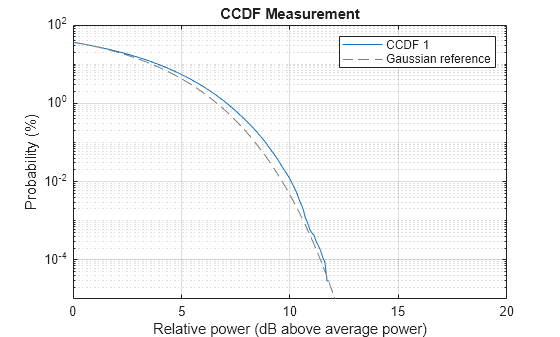
Measure CCDF
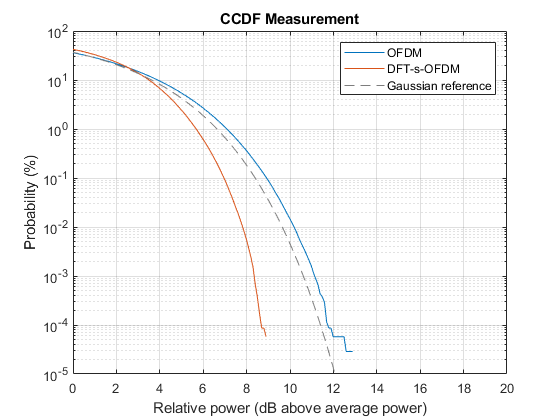
Measure the CCDF to evaluate the PAPR of the waveform.
measureCCDF =true; if measureCCDF pm = powermeter(ComputeCCDF=true); averagePower = pm(impariredWaveform); disp("Average power: "+averagePower+" dBm") figure; plotCCDF(pm,GaussianReference=true) end
Average power: 11.6919 dBm
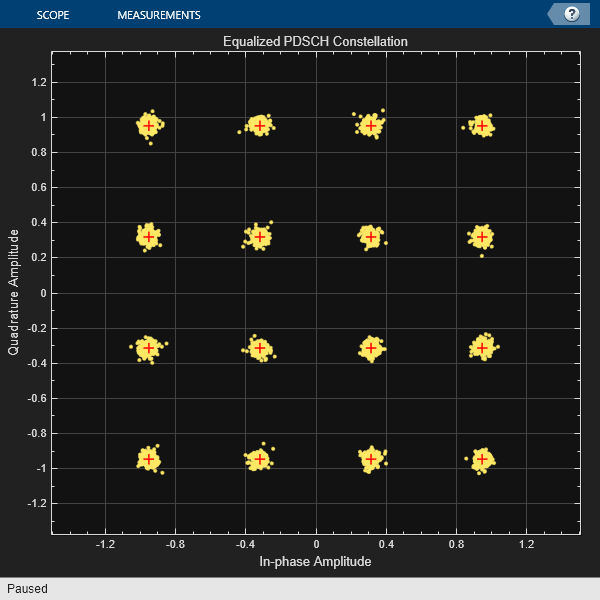
Measure EVM
Use the hpre6GMeasurePDSCHEVM function to analyze the waveform. In this example, the function:
Synchronizes the received waveform
Demodulates the received waveform
Estimates the channel
Equalizes the PDSCH symbols
Recovers transform deprecoded symbols if necessary
Estimates and compensates the common phase error (CPE)
Computes the PDSCH EVM
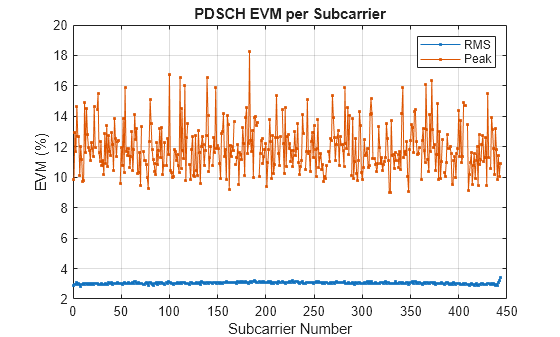
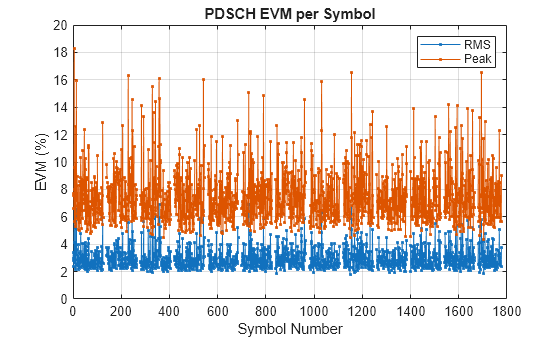
Additionally, the hpre6GMeasurePDSCHEVM function outputs the RMS and peak EVM statistics on a per slot basis and provides figures of the RMS and peak EVM on a per subcarrier and per symbol basis.
% Ignore transients in first part of waveform
rxWaveform = impariredWaveform;
rxWaveform(1:slotLength,:) = [];

evmInfo = hpre6GPDSCHEVM(rxWaveform,carrier,pdsch,Nfft=ofdmInfo.Nfft,TDDConfig=tddConfig,WaveformModulation=waveform);
Slot 0 PDSCH EVM, RMS: 3.799% Peak: 18.271% Slot 1 PDSCH EVM, RMS: 3.266% Peak: 15.914% Slot 2 PDSCH EVM, RMS: 3.156% Peak: 10.814% Slot 3 PDSCH EVM, RMS: 3.093% Peak: 12.357% Slot 4 PDSCH EVM, RMS: 2.958% Peak: 11.226% Slot 5 PDSCH EVM, RMS: 2.599% Peak: 8.484% Slot 6 PDSCH EVM, RMS: 2.710% Peak: 8.907% Slot 7 PDSCH EVM, RMS: 2.944% Peak: 10.442% Slot 8 PDSCH EVM, RMS: 3.021% Peak: 12.893% Slot 10 PDSCH EVM, RMS: 3.096% Peak: 9.813% Slot 11 PDSCH EVM, RMS: 2.763% Peak: 8.355% Slot 12 PDSCH EVM, RMS: 3.202% Peak: 10.601% Slot 13 PDSCH EVM, RMS: 3.459% Peak: 9.513% Slot 14 PDSCH EVM, RMS: 2.901% Peak: 12.639% Slot 15 PDSCH EVM, RMS: 2.726% Peak: 8.866% Slot 16 PDSCH EVM, RMS: 3.231% Peak: 16.336% Slot 17 PDSCH EVM, RMS: 3.512% Peak: 14.531% Slot 18 PDSCH EVM, RMS: 2.788% Peak: 11.131% Slot 20 PDSCH EVM, RMS: 3.140% Peak: 14.098% Slot 21 PDSCH EVM, RMS: 2.631% Peak: 8.057% Slot 22 PDSCH EVM, RMS: 3.159% Peak: 10.936% Slot 23 PDSCH EVM, RMS: 3.193% Peak: 15.477% Slot 24 PDSCH EVM, RMS: 3.489% Peak: 14.408% Slot 25 PDSCH EVM, RMS: 4.090% Peak: 16.114% Slot 26 PDSCH EVM, RMS: 2.723% Peak: 9.945% Slot 27 PDSCH EVM, RMS: 2.562% Peak: 7.878% Slot 28 PDSCH EVM, RMS: 2.871% Peak: 8.536% Slot 30 PDSCH EVM, RMS: 2.871% Peak: 9.749% Slot 31 PDSCH EVM, RMS: 3.185% Peak: 10.980% Slot 32 PDSCH EVM, RMS: 2.729% Peak: 10.309% Slot 33 PDSCH EVM, RMS: 2.685% Peak: 9.356% Slot 34 PDSCH EVM, RMS: 3.053% Peak: 10.359% Slot 35 PDSCH EVM, RMS: 2.622% Peak: 8.358% Slot 36 PDSCH EVM, RMS: 3.138% Peak: 12.383% Slot 37 PDSCH EVM, RMS: 3.256% Peak: 12.670% Slot 38 PDSCH EVM, RMS: 3.316% Peak: 16.051% Slot 40 PDSCH EVM, RMS: 3.046% Peak: 11.850% Slot 41 PDSCH EVM, RMS: 2.612% Peak: 7.935% Slot 42 PDSCH EVM, RMS: 2.957% Peak: 11.469% Slot 43 PDSCH EVM, RMS: 2.822% Peak: 9.282% Slot 44 PDSCH EVM, RMS: 2.810% Peak: 11.864% Slot 45 PDSCH EVM, RMS: 2.817% Peak: 9.169% Slot 46 PDSCH EVM, RMS: 3.133% Peak: 11.192% Slot 47 PDSCH EVM, RMS: 2.571% Peak: 7.752% Slot 48 PDSCH EVM, RMS: 3.351% Peak: 13.032% Slot 50 PDSCH EVM, RMS: 2.874% Peak: 10.677% Slot 51 PDSCH EVM, RMS: 2.599% Peak: 11.264% Slot 52 PDSCH EVM, RMS: 3.775% Peak: 15.109% Slot 53 PDSCH EVM, RMS: 2.813% Peak: 10.209% Slot 54 PDSCH EVM, RMS: 2.894% Peak: 11.866% Slot 55 PDSCH EVM, RMS: 2.862% Peak: 9.211% Slot 56 PDSCH EVM, RMS: 3.240% Peak: 14.833% Slot 57 PDSCH EVM, RMS: 2.843% Peak: 8.718% Slot 58 PDSCH EVM, RMS: 3.031% Peak: 11.522% Slot 60 PDSCH EVM, RMS: 3.088% Peak: 12.636% Slot 61 PDSCH EVM, RMS: 2.694% Peak: 7.718% Slot 62 PDSCH EVM, RMS: 3.249% Peak: 9.984% Slot 63 PDSCH EVM, RMS: 3.384% Peak: 11.435% Slot 64 PDSCH EVM, RMS: 2.956% Peak: 9.322% Slot 65 PDSCH EVM, RMS: 2.825% Peak: 11.416% Slot 66 PDSCH EVM, RMS: 3.057% Peak: 10.109% Slot 67 PDSCH EVM, RMS: 3.213% Peak: 11.821% Slot 68 PDSCH EVM, RMS: 3.376% Peak: 14.578% Slot 70 PDSCH EVM, RMS: 3.007% Peak: 11.383% Slot 71 PDSCH EVM, RMS: 2.877% Peak: 10.508% Slot 72 PDSCH EVM, RMS: 2.886% Peak: 9.523% Slot 73 PDSCH EVM, RMS: 3.529% Peak: 15.877% Slot 74 PDSCH EVM, RMS: 2.449% Peak: 7.757% Slot 75 PDSCH EVM, RMS: 2.845% Peak: 9.454% Slot 76 PDSCH EVM, RMS: 3.144% Peak: 9.689% Slot 77 PDSCH EVM, RMS: 2.606% Peak: 11.996% Slot 78 PDSCH EVM, RMS: 2.789% Peak: 9.186% Slot 80 PDSCH EVM, RMS: 3.358% Peak: 10.848% Slot 81 PDSCH EVM, RMS: 2.923% Peak: 10.066% Slot 82 PDSCH EVM, RMS: 3.500% Peak: 16.543% Slot 83 PDSCH EVM, RMS: 3.108% Peak: 12.117% Slot 84 PDSCH EVM, RMS: 3.267% Peak: 11.308% Slot 85 PDSCH EVM, RMS: 3.366% Peak: 11.599% Slot 86 PDSCH EVM, RMS: 3.086% Peak: 10.154% Slot 87 PDSCH EVM, RMS: 3.147% Peak: 11.561% Slot 88 PDSCH EVM, RMS: 3.110% Peak: 13.722% Slot 90 PDSCH EVM, RMS: 3.028% Peak: 10.001% Slot 91 PDSCH EVM, RMS: 2.874% Peak: 8.963% Slot 92 PDSCH EVM, RMS: 3.015% Peak: 12.598% Slot 93 PDSCH EVM, RMS: 2.621% Peak: 8.876% Slot 94 PDSCH EVM, RMS: 2.723% Peak: 9.781% Slot 95 PDSCH EVM, RMS: 2.685% Peak: 9.163% Slot 96 PDSCH EVM, RMS: 3.092% Peak: 10.258% Slot 97 PDSCH EVM, RMS: 2.930% Peak: 10.528% Slot 98 PDSCH EVM, RMS: 3.010% Peak: 11.142% Slot 100 PDSCH EVM, RMS: 3.111% Peak: 13.874% Slot 101 PDSCH EVM, RMS: 2.971% Peak: 10.325% Slot 102 PDSCH EVM, RMS: 3.099% Peak: 11.028% Slot 103 PDSCH EVM, RMS: 3.068% Peak: 11.527% Slot 104 PDSCH EVM, RMS: 3.033% Peak: 11.489% Slot 105 PDSCH EVM, RMS: 2.828% Peak: 10.125% Slot 106 PDSCH EVM, RMS: 2.715% Peak: 9.397% Slot 107 PDSCH EVM, RMS: 3.147% Peak: 13.357% Slot 108 PDSCH EVM, RMS: 3.174% Peak: 11.758% Slot 110 PDSCH EVM, RMS: 3.097% Peak: 10.773% Slot 111 PDSCH EVM, RMS: 3.378% Peak: 14.182% Slot 112 PDSCH EVM, RMS: 2.854% Peak: 9.594% Slot 113 PDSCH EVM, RMS: 3.346% Peak: 14.114% Slot 114 PDSCH EVM, RMS: 2.844% Peak: 10.998% Slot 115 PDSCH EVM, RMS: 3.394% Peak: 12.679% Slot 116 PDSCH EVM, RMS: 2.799% Peak: 10.059% Slot 117 PDSCH EVM, RMS: 3.223% Peak: 13.916% Slot 118 PDSCH EVM, RMS: 3.174% Peak: 13.782% Slot 120 PDSCH EVM, RMS: 3.089% Peak: 13.224% Slot 121 PDSCH EVM, RMS: 3.436% Peak: 16.543% Slot 122 PDSCH EVM, RMS: 3.123% Peak: 12.991% Slot 123 PDSCH EVM, RMS: 2.986% Peak: 10.184% Slot 124 PDSCH EVM, RMS: 2.951% Peak: 10.499% Slot 125 PDSCH EVM, RMS: 2.742% Peak: 9.574% Slot 126 PDSCH EVM, RMS: 3.092% Peak: 12.278% Overall PDSCH EVM, RMS: 3.043% Peak: 18.271%
Further Exploration
Try changing the waveform modulation type to DFT-s-OFDM. Using DFT-s-OFDM results in a lower PAPR than OFDM. As the PTRS is inserted pre-DFT the EVM may be higher compared to using an OFDM waveform as tracking phase noise is more challenging [3].
References
[1] Hexa-X Deliverable D2.3 - Radio models and enabling techniques towards ultra-high data rate links and capacity in 6G.
[2] Hexa-X Deliverable D2.2 - Initial radio models and analysis towards ultra-high data rate links in 6G.
[3] Y. Qi, M. Hunukumbure, H. Nam, H. Yoo and S. Amuru, "On the Phase Tracking Reference Signal (PT-RS) Design for 5G New Radio (NR)," 2018 IEEE 88th Vehicular Technology Conference (VTC-Fall), Chicago, IL, USA, 2018, pp. 1-5, doi: 10.1109/VTCFall.2018.8690852.
Local Functions
function y = paMemorylessGaN(x)
    % Model 28 GHz GaN power amplifier as defined in R4-165901 Section 2.1.4

    ak = [-0.334697-0.942326i; 0.89015-0.72633i; -2.58056+4.81215i; 4.81548-9.54837i; -4.41452+8.63164i; 1.54271-2.94034i];
    y = x.*abs(x).^(2*(0:5))*ak;
end

function visualizeAMAMCharacteristic(paModel,modelName)
    % Plot the nonlinear characteristic of the power amplifier impairment

    x = logspace(-1.5,0).'; % Input samples with normalized input power
    y = paModel(x); % Nonlinearity

    figure;
    plot(pow2db(abs(x).^2),pow2db(abs(y).^2),'-');
    hold on;
    plot(pow2db(abs(x).^2),pow2db(abs(x).^2),'-.');
    grid on
    xlabel("Instantaneous normalized Input Power (dBW)");
    ylabel("Instanteneous Output Power (dBW)");
    title("AM/AM, "+modelName)
    legend(modelName+" characteristic","Linear characteristic",Location="Northwest");
end

function visualizeTDDAllocation(tddConfig)
    % Show the TDD allocation pattern

    x = [0 1 1 0];
    y = [0 0 1 1];
    xTxtPos = (x(2)-x(1))/2+x(1);
    yTxtPos = (y(3)-y(1))/2+y(1)-1; % Position text below patch blocks

    hp = [];
    t = [];
    f = figure;
    for i = 0:tddConfig.TDDPeriod-1
        if isSlotActive(i,tddConfig)
            patchColorIdx = 1; % DL slot
            txt = "D";
        else
            patchColorIdx = 2; % UL slot
            txt = "U";
        end
        hp = [hp patch(x+i,y,0,CDataMode="auto",SeriesIndex=patchColorIdx)]; % Use patch color from axis color series
        t = [t txt];
        hold on;
        text(xTxtPos+i,yTxtPos,txt,HorizontalAlignment="center")
    end
    title(join(["TDD allocation pattern," num2str(tddConfig.TDDPeriod) "slot period"]))
    axis off
    set(gca,"DataAspectRatio",[1 1 1],"YLim",[yTxtPos*2 y(3)+0.25]); % Set limits to create space between data and title

    pos = get(gcf,"Position");
    yScaleFactor = 3; % Scale figure to avoid excessive empty space above and below
    set(f,"Position",[pos(1) pos(2) pos(3) pos(4)/yScaleFactor]);

    hpdl = hp(find(t=="D",1)); % Handle of first downlink slot
    hpul = hp(find(t=="U",1)); % Handle of first uplink slot
    legendTxt = ["Downlink slot" "Uplink slot"];
    legendTxt = legendTxt([any(t=="D") any(t=="U")]); % Remove entry if no downlink or uplink slots
    legend([hpdl hpul],legendTxt,location="eastoutside");
end

function isActive = isSlotActive(nSlot,tddConfig)
    % Returns true if the carrier slot number contains the PDSCH

    isActive = any(mod(nSlot,tddConfig.TDDPeriod) == mod(tddConfig.SlotAllocation,tddConfig.TDDPeriod));
end
See Also
pre6GCarrierConfig | pre6GPDSCHConfig