Main Content

energyTimeCurve

Compute energy-time curve

Since R2024a

    Description

    example

    [etc,t] = energyTimeCurve(s) computes the energy-time curve of the HRTF measurements in the horizontal plane at zero elevation.

    example

    [etc,t] = energyTimeCurve(s,Name=Value) specifies options using one or more name-value arguments.

    example

    [etc,t,ang] = energyTimeCurve(___) also returns the angles corresponding to the measurements.

    example

    energyTimeCurve(___) with no output arguments plots the energy-time curve.

    Examples

    collapse all

    Read in a SOFA file containing HRTF measurements.

    s = sofaread("ReferenceHRTF.sofa");

    Compute the energy-time curve of the HRTF data in the horizontal plane at zero elevation.

    [etc,t,azi] = energyTimeCurve(s);

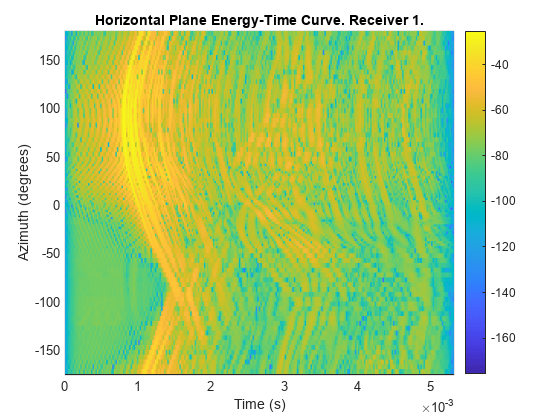
    Call energyTimeCurve with no output arguments to plot the energy-time curve.

    energyTimeCurve(s)

    Read in a SOFA file containing HRTF measurements.

    s = sofaread("ReferenceHRTF.sofa");

    Compute the energy-time curve of the HRTF data in the horizontal plane offset by 7 degrees of elevation. See how the returned value is empty because the SOFA file contains no measurements in the specified plane.

    etc = energyTimeCurve(s,Plane="horizontal",PlaneOffsetAngle=7);
    size(etc)
    ans = 1×2
    
         0     0


    Call energyTimeCurve with InterpolateHRTF set to true to compute the energy-time curve using interpolated HRTF measurements corresponding to 100 uniformly-spaced points in the specified plane.

    etc = energyTimeCurve(s,Plane="horizontal",PlaneOffsetAngle=7,InterpolateHRTF=true);
    size(etc)
    ans = 1×2
    
       256   100


    Input Arguments

    collapse all

    SOFA object, specified as a SimpleFreeFieldHRIR object.

    Name-Value Arguments

    Specify optional pairs of arguments as Name1=Value1,...,NameN=ValueN, where Name is the argument name and Value is the corresponding value. Name-value arguments must appear after other arguments, but the order of the pairs does not matter.

    Example: energyTimeCurve(s,Plane="median")

    Indices of the receivers to use for the energy-time curve, specified as a vector of positive integers.

    Data Types: single | double | int8 | int16 | int32 | int64 | uint8 | uint16 | uint32 | uint64

    Plane to compute the energy-time curve, specified as "horizontal", "median", or "sagittal".

    Data Types: char | string

    Plane offset angle in degrees, specified as a value in the range [-90,90]. This angle specifies the offset by which the Plane is shifted.

    This argument only applies to the horizontal and sagittal planes. For the horizontal plane, the offset corresponds to the elevation angle. For the sagittal plane, the offset corresponds to the lateral angle.

    Data Types: single | double | int8 | int16 | int32 | int64 | uint8 | uint16 | uint32 | uint64

    Angle tolerance in degrees, specified as a positive scalar. The function computes the energy-time curve for the measurements within the tolerance of the plane specified by Plane and PlaneOffsetAngle.

    Data Types: single | double | int8 | int16 | int32 | int64 | uint8 | uint16 | uint32 | uint64

    Use interpolated HRTF measurements, corresponding to 100 uniformly-spaced points in the specified plane, to compute the energy-time curve. Set this argument to true if the plane specified by Plane, PlaneOffsetAngle, and AngleTolerance does not contain a sufficient number of HRTF measurements. The function uses the bilinear interpolation method.

    Data Types: logical

    Output Arguments

    collapse all

    Energy-time curve, returned as an N-by-M-by-R array, where:

    • N is the length of the impulse response.

    • M is the number of selected measurements.

    • R is the number of selected receivers defined by Receiver.

    Time vector in seconds corresponding to the impulse response, returned as a vector of length N, where N is the length of the impulse response.

    Angles in degrees corresponding to the measurements used to compute the energy-time curve, returned as a vector. The interpretation of the angles depends on the specified Plane.

    • For the horizontal plane, the angles correspond to the azimuth.

    • For the median plane, the angles correspond to the elevation.

    • For the sagittal plane, the angles correspond to the polar angles.

    More About

    collapse all

    Energy-Time Curve

    The energy-time curve measures the energy of an impulse response in dB over time, showing the decay of sound energy as time progresses. The energyTimeCurve function computes the energy-time curve for all of the impulse responses the specified plane, which characterizes how sound energy decays in that plane according to the HRTF measurements.

    References

    [1] Davis, Don, and Joe Martinson. "Using Basic Energy Time Curve (ETC) Measurements." In Audio Engineering Society Convention 66. Audio Engineering Society, 1980.

    Version History

    Introduced in R2024a