plot
Render heatmap or clustergram
Description
plot( renders a heatmap or
clustergram of hm_cg_object)hm_cg_object.
plot(
displays a heatmap or clustergram in a MATLAB® figure specified by the figure handle hm_cg_object,hFig)hFig.
hAxes = plot(___)
Examples
Create a matrix of data.
data = gallery('invhess',20);Display a 2-D color heatmap of the data.
hmo = HeatMap(data);
             Standardize: '[column | row | {none}]'
               Symmetric: '[true | false].'
            DisplayRange: 'Scalar.'
                Colormap: []
               ImputeFun: 'string -or- function handle -or- cell array'
            ColumnLabels: 'Cell array of strings, or an empty cell array'
               RowLabels: 'Cell array of strings, or an empty cell array'
      ColumnLabelsRotate: []
         RowLabelsRotate: []
                Annotate: '[on | {off}]'
          AnnotPrecision: []
              AnnotColor: []
       ColumnLabelsColor: 'A structure array.'
          RowLabelsColor: 'A structure array.'
       LabelsWithMarkers: '[true | false].'
    ColumnLabelsLocation: '[ top | {bottom} ]'
       RowLabelsLocation: '[ {left} | right ]'

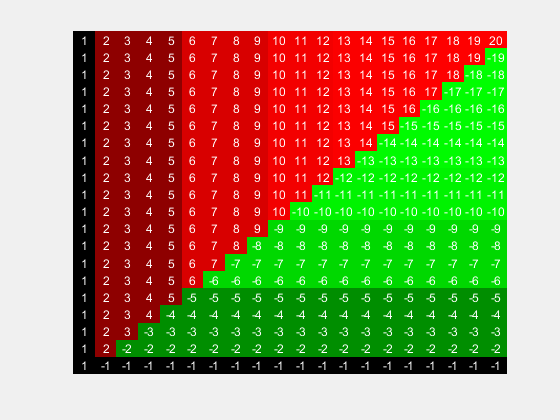
Display the data values in the heatmap.
hmo.Annotate = true;
view(hmo)
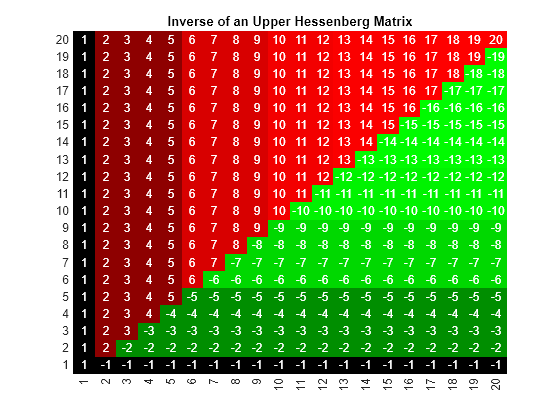
Use the plot function to display the heatmap in another figure specified by the figure handle fH.
fH = figure;
hA = plot(hmo,fH);

Use the returned axes handle hA to specify the axes properties.
hA.Title.String = 'Inverse of an Upper Hessenberg Matrix';
hA.XTickLabelMode = 'auto';
hA.YTickLabelMode = 'auto';
Input Arguments
Output Arguments
Version History
Introduced in R2009b