redbluecmap
Create red and blue colormap
Description
redbluecmap( returns a
length)length-by-3 matrix containing a red and blue
diverging color palette. Low values are dark blue, values in the center of the map are
white, and high values are dark red. length must be a positive integer
between 3 and 11.
redbluecmap returns an
11-by-3 matrix representing 11 colors.
Examples
Load microarray data containing gene expression levels of Saccharomyces cerevisiae (yeast) during the metabolic shift from fermentation to respiration [1].
load filteredyeastdata
This MAT file includes three variables, which are added to the MATLAB® workspace:
- yeastvalues - A matrix of gene expression data from Saccharomyces -_cerevisiae_ during the metabolic shift from fermentation to respiration - genes - A cell array of GenBank® accession numbers for labeling the rows in yeastvalues - times - A vector of time values for labeling the columns in yeastvalues
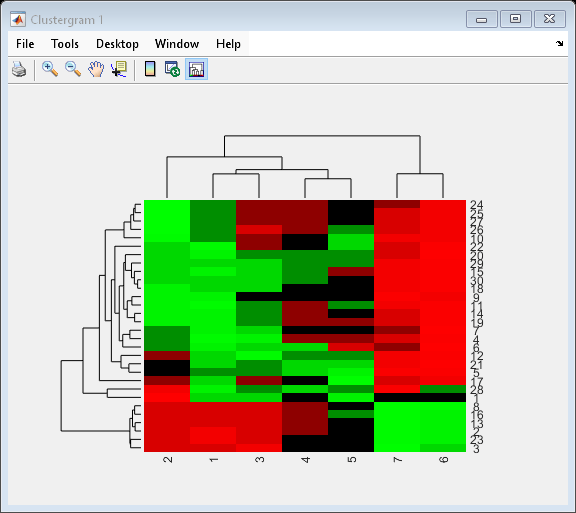
Create a clustergram object to display the heat map from the gene expression data in the first 30 rows of the yeastvalues matrix and standardize along the rows of data.
cgo = clustergram(yeastvalues(1:30,:),'Standardize','Row')
Clustergram object with 30 rows of nodes and 7 columns of nodes.

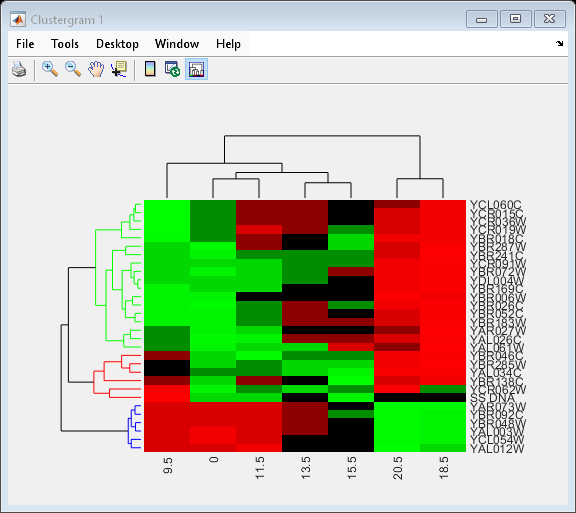
Use the set method and the genes and times vectors to add meaningful row and column labels to the clustergram.
set(cgo,'RowLabels',genes(1:30),'ColumnLabels',times)

Add a color bar to the clustergram by clicking the Insert Colorbar button on the toolbar.
View a data tip containing the intensity value, row label, and column label for a specific area of the heat map by clicking the Data Cursor button on the toolbar, then clicking an area in the heat map. To delete this data tip, right-click it, then select Delete Current Datatip.
Display intensity values for each area of the heat map by clicking the Annotate button on the toolbar. Click the Annotate button again to remove the intensity values.
Tip: If the amount of data is large enough, the cells within the clustergram
are too small to display the intensity annotations. Zoom in to see the
intensity annotations.
Remove the dendrogram tree diagrams from the figure by clicking the Show Dendrogram button on the toolbar. Click it again to display the dendrograms.
Use the get method to display the properties of the clustergram object, cgo.
get(cgo)
               Cluster: 'ALL'
              RowPDist: {'Euclidean'}
           ColumnPDist: {'Euclidean'}
               Linkage: {'Average'}
            Dendrogram: {}
      OptimalLeafOrder: 1
              LogTrans: 0
          DisplayRatio: [0.2000 0.2000]
        RowGroupMarker: []
     ColumnGroupMarker: []
        ShowDendrogram: 'on'
           Standardize: 'ROW'
             Symmetric: 1
          DisplayRange: 3
              Colormap: [11×3 double]
             ImputeFun: []
          ColumnLabels: {1×7 cell}
             RowLabels: {30×1 cell}
    ColumnLabelsRotate: 90
       RowLabelsRotate: 0
              Annotate: 'off'
        AnnotPrecision: 2
            AnnotColor: 'w'
     ColumnLabelsColor: []
        RowLabelsColor: []
     LabelsWithMarkers: 0
Change the clustering parameters by changing the linkage method and changing the color of the groups of nodes in the dendrogram whose linkage is less than a threshold of 3.
set(cgo,'Linkage','complete','Dendrogram',3)

Place the cursor on a branch node in the dendrogram to highlight (in blue) the group associated with it. Press and hold the mouse button to display a data tip listing the group number and the nodes (genes or samples) in the group.

Right-click a branch node in the dendrogram to display a menu of options.

The following options are available:
- Set Group Color - Change the cluster group color. - Print Group to Figure - Print the group to a figure window. - Copy Group to New Clustergram - Copy the group to a new clustergram window. - Export Group to Workspace - Create a clustergram object of the group in the MATLAB workspace. - Export Group Info to Workspace - Create a structure containing information about the group in the MATLAB workspace. The structure contains these fields:
- GroupNames - Cell array of character vectors containing the names of the row or column groups. - RowNodeNames - Cell array of character vectors containing the names of the row nodes. - ColumnNodeNames - Cell array of character vectors containing the names of the column nodes. - ExprValues - An M-by-N matrix of intensity values, where M and N are the number of row nodes and of column nodes respectively. If the matrix contains gene expression data, typically each row corresponds to a gene and each column corresponds to sample.
Create a clustergram object for Group 18 in the MATLAB workspace. Right-click Group 18, then select Export Group to Workspace. In the Export to Workspace dialog box, type Group18, then click OK.
Use the view method to view the clustergram object, Group18.
view(Group18)

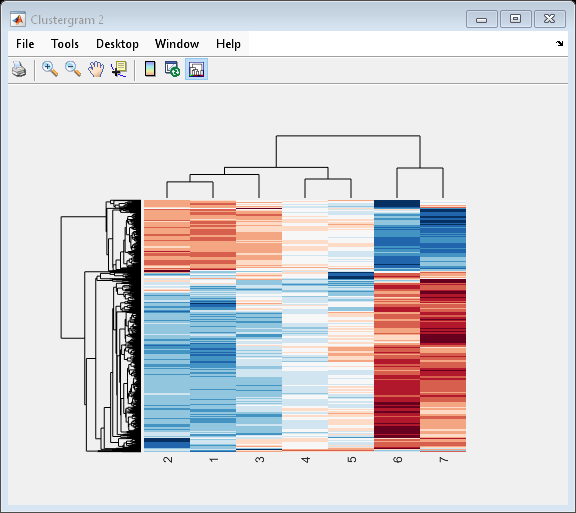
View all the gene expression data using a diverging red and blue colormap and standardize along the rows of data.
cgo_all = clustergram(yeastvalues,'Colormap',redbluecmap,'Standardize','Row')
Clustergram object with 614 rows of nodes and 7 columns of nodes.

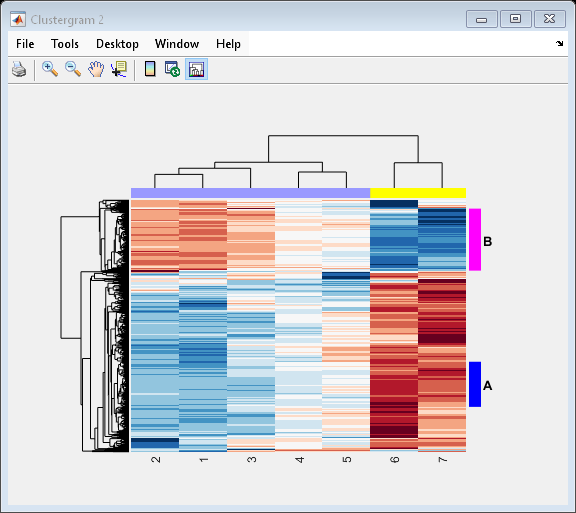
Create structure arrays to specify marker colors and annotations for two groups of rows (510 and 593) and two groups of columns (4 and 5).
rm = struct('GroupNumber',{510,593},'Annotation',{'A','B'},...
     'Color',{'b','m'});
cm = struct('GroupNumber',{4,5},'Annotation',{'Time1','Time2'},...
     'Color',{[1 1 0],[0.6 0.6 1]});
Use the RowGroupMarker and ColumnGroupMarker properties to add the color markers and annotations to the clustergram.
set(cgo_all,'RowGroupMarker',rm,'ColumnGroupMarker',cm)

Input Arguments
Number of colors in the colormap, specified as a positive integer between 3 and 11.
Example: 4
Data Types: double
References
[1] DeRisi, J. L. “Exploring the Metabolic and Genetic Control of Gene Expression on a Genomic Scale.” Science 278, no. 5338 (October 24, 1997): 680–86.
Version History
Introduced in R2008a
MATLAB Command
You clicked a link that corresponds to this MATLAB command:
Run the command by entering it in the MATLAB Command Window. Web browsers do not support MATLAB commands.
Seleccione un país/idioma
Seleccione un país/idioma para obtener contenido traducido, si está disponible, y ver eventos y ofertas de productos y servicios locales. Según su ubicación geográfica, recomendamos que seleccione: .
También puede seleccionar uno de estos países/idiomas:
Cómo obtener el mejor rendimiento
Seleccione China (en idioma chino o inglés) para obtener el mejor rendimiento. Los sitios web de otros países no están optimizados para ser accedidos desde su ubicación geográfica.
América
- América Latina (Español)
- Canada (English)
- United States (English)
Europa
- Belgium (English)
- Denmark (English)
- Deutschland (Deutsch)
- España (Español)
- Finland (English)
- France (Français)
- Ireland (English)
- Italia (Italiano)
- Luxembourg (English)
- Netherlands (English)
- Norway (English)
- Österreich (Deutsch)
- Portugal (English)
- Sweden (English)
- Switzerland
- United Kingdom (English)