Main Content

pmdemod

Phase demodulation

Description

z = pmdemod(y,Fc,Fs,phasedev) demodulates the modulated message signal y using phase modulation.

example

z = pmdemod(y,Fc,Fs,phasedev,ini_phase) specifies the initial phase of the demodulated signal.

Examples

collapse all

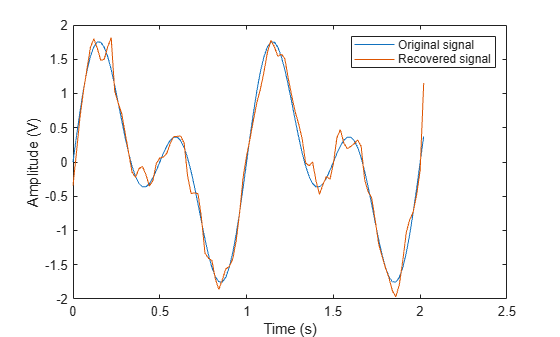
Set the sample rate. To plot the signals, create a time vector.

fs = 50; 
t = (0:2*fs+1)'/fs;

Create a sinusoidal input signal.

x = sin(2*pi*t) + sin(4*pi*t);

Set the carrier frequency and phase deviation.

fc = 10; 
phasedev = pi/2;

Modulate the input signal.

tx = pmmod(x,fc,fs,phasedev);

Pass the signal through an AWGN channel.

rx = awgn(tx,10,'measured');

Demodulate the noisy signal.

y = pmdemod(rx,fc,fs,phasedev);

Plot the original and recovered signals.

figure; plot(t,[x y]);
legend('Original signal','Recovered signal');
xlabel('Time (s)')
ylabel('Amplitude (V)')

Figure contains an axes object. The axes object with xlabel Time (s), ylabel Amplitude (V) contains 2 objects of type line. These objects represent Original signal, Recovered signal.

Input Arguments

collapse all

Phase modulated input signal, specified as vector or matrix. The columns of y represent independent channels.

Data Types: single | double

Carrier frequency in Hz, specified as a positive scalar.

Data Types: double

Sample rate in Hz, specified as a positive scalar. Fs must be at least 2Fc.

Data Types: double

Initial phase of the modulated signal in radians, specified as a real scalar.

Example: pi/4

Data Types: double

Phase deviation in radians, specified as a positive scalar.

Data Types: double

Output Arguments

collapse all

Demodulated signal, returned as a vector or a matrix.

Data Types: single | double

Version History

Introduced before R2006a