Main Content

scatterplot

Display input signal in IQ-plane

Description

example

scatterplot(x) creates a scatter plot to display the input signal x in the IQ-plane. Specifically, the IQ-plane displays the in-phase and quadrature components of a modulated signal on the real and imaginary axis of an xy-plot.

scatterplot(x,n) specifies decimation factor n. The function plots every nth value of x, starting from its first value.

scatterplot(x,n,offset) specifies the offset value. The function plots every nth value of x, starting from its (offset + 1)th value.

scatterplot(x,n,offset,plotstring) specifies plot attributes for the scatter plot.

scatterplot(x,n,offset,plotstring,scatfig) generates the scatter plot in the existing Figure object, scatfig. To plot multiple signals in the same figure, use hold on.

scatfig = scatterplot(___) returns the Figure object of the scatter plot. Use scatfig to query or modify properties of the figure after it is created. You can specify any of the input argument combinations from the previous syntaxes.

Examples

collapse all

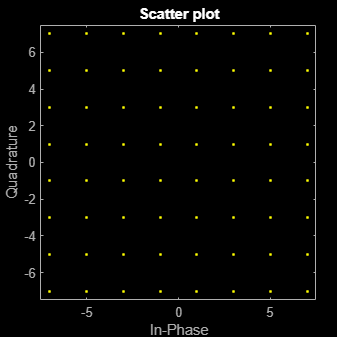
Create a 64-QAM signal in which each constellation point is used.

d = (0:63)';
s = qammod(d,64);

Display the scatter plot of the constellation.

scatterplot(s)

Figure Scatter Plot contains an axes object. The axes object with title Scatter plot, xlabel In-Phase, ylabel Quadrature contains a line object which displays its values using only markers. This object represents Channel 1.

Input Arguments

collapse all

Input signal, specified as a vector or matrix.

The interpretation of x depends on its shape and complexity.

  • If x is a real-valued two-column matrix, the function interprets the first column as in-phase components and the second column as quadrature components.

  • If x is a complex-valued vector, the function interprets the real part as in-phase components and the imaginary part as quadrature components.

  • If x is a real-valued vector, the function interprets it as a real signal.

Data Types: double | single
Complex Number Support: Yes

Decimation factor, specified as a positive integer. The function plots every nth value of input signal x, starting from its first value.

Data Types: double

Offset value, specified as a nonnegative integer. This offset value specifies the number of samples at the beginning of input x that the function skips before generating the scatter plot.

Data Types: double

Plot attributes, specified as a character vector or string scalar containing symbols.

This argument sets the plotting symbol, line type, and color for the scatter plot. The format and meaning of the symbols are the same as in the plot function. For example, the default value 'b.' produces blue dots.

Data Types: char | string

Target scatterplot, specified as a Figure object for a previously generated scatterplot.

Output Arguments

collapse all

Target scatterplot, returned as a Figure object. To modify properties of this object, see Figure Properties.

Version History

Introduced before R2006a