Esta página es para la versión anterior. La página correspondiente en inglés ha sido eliminada en la versión actual.
Aproximación de funciones GRNN
Este ejemplo utiliza las funciones NEWGRNN y SIM.
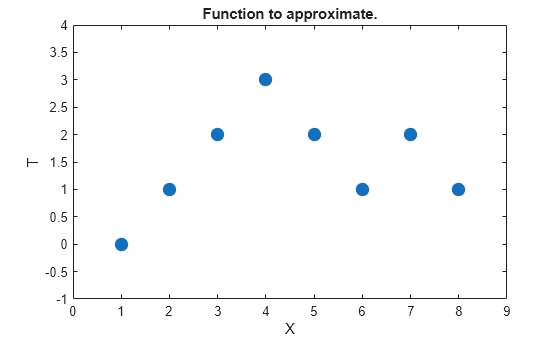
Estos son los ocho puntos de datos de la función y que deseamos ajustar. Las entradas de las funciones X deben generar como resultado salidas objetivo T.
X = [1 2 3 4 5 6 7 8];
T = [0 1 2 3 2 1 2 1];

plot(X,T,'.','markersize',30)
axis([0 9 -1 4])
title('Function to approximate.')
xlabel('X')
ylabel('T')
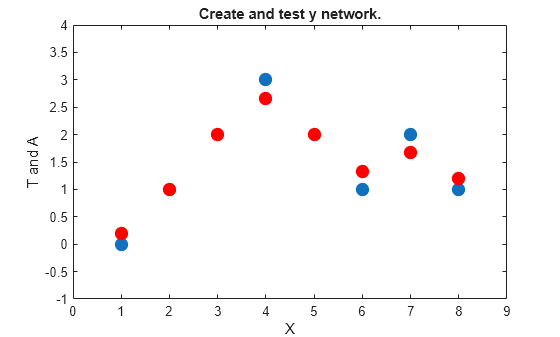
Usamos NEWGRNN para crear la red de regresión generalizada y. Usamos una SPREAD de y ligeramente inferior a 1, la distancia entre valores de entrada, en orden, para obtener una función y que ajuste los puntos de datos individuales al máximo. Una dispersión menor ajustaría mejor los datos, pero sería menos suave.
spread = 0.7;
net = newgrnn(X,T,spread);
A = net(X);

hold on
outputline = plot(X,A,'.','markersize',30,'color',[1 0 0]);
title('Create and test y network.')
xlabel('X')
ylabel('T and A')
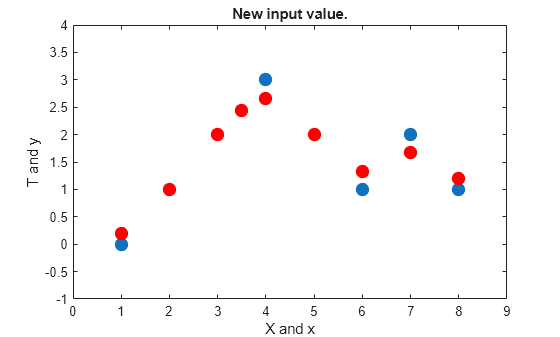
También podemos usar la red para aproximar la función al valor de la nueva entrada de y.
x = 3.5;
y = net(x);
plot(x,y,'.','markersize',30,'color',[1 0 0]);
title('New input value.')
xlabel('X and x')
ylabel('T and y')
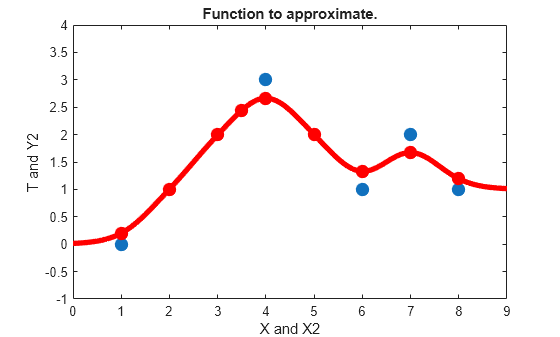
En este caso, la respuesta de la red se simula para muchos valores, lo que nos permite ver la función que representa.
X2 = 0:.1:9;
Y2 = net(X2);
plot(X2,Y2,'linewidth',4,'color',[1 0 0])
title('Function to approximate.')
xlabel('X and X2')
ylabel('T and Y2')