View Execution Times
You can run a software-in-the-loop (SIL) or processor-in-the-loop (PIL) execution that produces execution-time metrics for tasks and functions in your generated code. During execution, you can use the Simulation Data Inspector to observe streamed execution times. When execution is complete, you can:
View execution-time metrics for a profiled entry-point function.
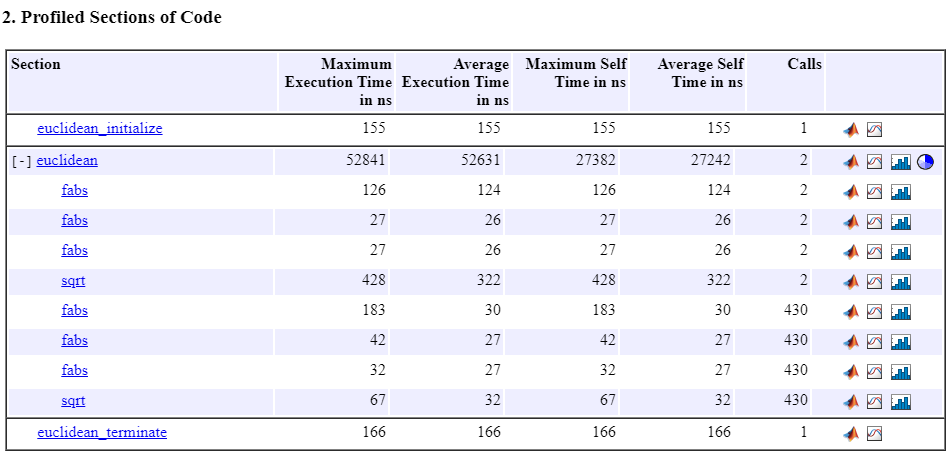
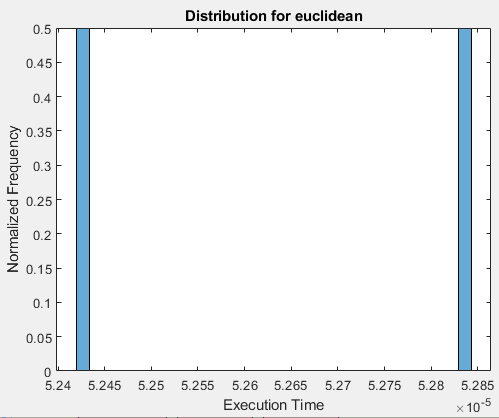
Open a report of execution-time metrics for all profiled functions. Through report icons, you can view, for example, the profiled code section and the execution-time distribution for each profiled function.
Use the Simulation Data Inspector to plot and compare execution times from various execution runs.
Code Execution Profiling Report
When you run a SIL or PIL execution with execution time profiling enabled, the software generates a message in the Command Window. For example:
Current plot held
### Starting SIL execution for 'euclidean'
    To terminate execution: clear euclidean_sil
    Execution profiling data is available for viewing. Go to Simulation Data Inspector.
    Execution profiling report available after termination.
To observe streamed execution times while the execution runs, click the Simulation Data Inspector link.
To open the code execution profiling report:
Click the
clear euclidean_sillink.The software terminates the execution process and displays a new link.
### Stopping SIL execution for 'euclidean'
    Execution profiling report: report(getCoderExecutionProfile('euclidean'))
Click the new link.
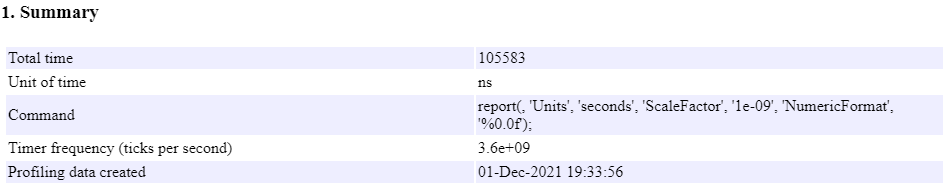
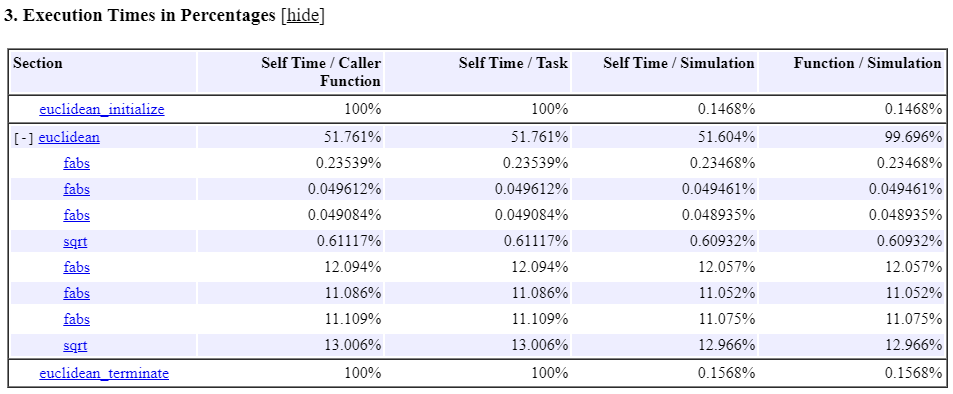
The report contains these sections:

Visualize Task Scheduling
You can use the Simulation Data Inspector to visualize task scheduling and the
order of function calls. At the end of the execution, run the schedule function. For more information, see Visualize Task Scheduling.