Simulation Data Inspector
Inspeccionar y comparar datos y resultados de simulación para validar e iterar diseños de modelo
Descripción
Simulation Data Inspector visualiza y compara múltiples tipos de datos.
Con Simulation Data Inspector, puede inspeccionar y comparar datos de series temporales en múltiples fases del flujo de trabajo. Este flujo de trabajo de ejemplo muestra cómo Simulation Data Inspector admite todas las fases del ciclo de diseño:
View Simulation Data in Simulation Data Inspector o Import Data from Workspace or File into Simulation Data Inspector
Ejecutar una simulación en un modelo configurado para registrar datos en Simulation Data Inspector o importar datos del área de trabajo o un archivo. Puede ver y verificar los datos de entrada del modelo o inspeccionar los datos de simulación registrados mientras se modifica iterativamente el diagrama del modelo, los valores de parámetros o la configuración del modelo. Para obtener más información sobre cómo registrar datos de simulación, consulte Save Simulation Data.
Representar señales en múltiples subgráficas, hacer zoom y alejar ejes de gráficas especificados, y utilizar cursores de datos para comprender y evaluar los datos. Puede elegir entre múltiples visualizaciones, como tiempo, arreglo, mapa, minigráficos y gráficas XY. Para obtener más información sobre cómo presentar datos de forma eficaz, consulte Create Plots Using the Simulation Data Inspector.
Comparar señales individuales o ejecuciones de simulación, y analizar los resultados de la comparación con tolerancia relativa, absoluta y de tiempo. Las herramientas de Simulation Data Inspector facilitan el diseño iterativo y permiten resaltar señales que no cumplen los requisitos de tolerancia. Para obtener más información sobre la operación de comparación, consulte How the Simulation Data Inspector Compares Data.
Save and Share Simulation Data Inspector Data and Views
Comparta sus hallazgos con otras personas guardando los datos y las vistas de Simulation Data Inspector.
También puede utilizar las prestaciones de Simulation Data Inspector desde la línea de comandos. Para obtener más información, consulte Inspect Data Programmatically y Compare Data Programmatically.

Abrir Simulation Data Inspector
Barra de herramientas de Simulink®: En la pestaña Simulation, en Review Results, haga clic en Data Inspector.
Desde un modelo: haga clic en el símbolo de transmisión de una señal para abrir Simulation Data Inspector y representar la señal.
En la línea de comandos de MATLAB®:
Escriba
Simulink.sdi.viewpara abrir Simulation Data Inspector.Utilice
Simulink.sdi.plotpara abrir Simulation Data Inspector y representar datos.
Ejemplos
Cree una ejecución, añada datos y, después, visualice los datos en Simulation Data Inspector.
Crear datos para una ejecución
Cree dos objetos timeseries para contener datos para una señal sinusoidal y una señal de coseno. Asigne a cada objeto timeseries un nombre descriptivo.
time = linspace(0,20,101);

sine_vals = sin(2*pi/5*time);
sine_ts = timeseries(sine_vals,time);
sine_ts.Name = "Sine, T=5";

cos_vals = cos(2*pi/8*time);
cos_ts = timeseries(cos_vals,time);
cos_ts.Name = "Cosine, T=8";
Crear una ejecución y añadir datos
Use la función Simulink.sdi.view para abrir Simulation Data Inspector.
Simulink.sdi.view
Para importar datos a Simulation Data Inspector desde el área de trabajo, cree un objeto Simulink.sdi.Run con la función Simulink.sdi.Run.create. Añada información sobre la ejecución a sus metadatos utilizando las propiedades Name y Description del objeto Run.
sinusoidsRun = Simulink.sdi.Run.create;
sinusoidsRun.Name = "Sinusoids";
sinusoidsRun.Description = "Sine and cosine signals with different frequencies";
Use la función add para añadir los datos que ha creado en el área de trabajo a la ejecución vacía.
add(sinusoidsRun,"vars",sine_ts,cos_ts);Representar datos en Simulation Data Inspector
Utilice la función getSignalByIndex para acceder a objetos Simulink.sdi.Signal que contengan los datos de señales. Puede utilizar las propiedades del objeto Simulink.sdi.Signal para especificar el estilo y color de línea para la señal y representar la señal en Simulation Data Inspector. Especifique las propiedades LineColor y LineDashed para cada señal.
sine_sig = getSignalByIndex(sinusoidsRun,1);
sine_sig.LineColor = [0 0 1];
sine_sig.LineDashed = "-.";

cos_sig = sinusoidsRun.getSignalByIndex(2);
cos_sig.LineColor = [1 0 0];
cos_sig.LineDashed = "--";
Use la función Simulink.sdi.setSubPlotLayout para configurar un diseño de subgráfica de 2 por 1 en el área de representación de Simulation Data Inspector. Luego, utilice la función plotOnSubplot para representar la señal sinusoidal en la subgráfica superior y la señal de coseno en la inferior.
Simulink.sdi.setSubPlotLayout(2,1);

plotOnSubPlot(sine_sig,1,1,true);
plotOnSubPlot(cos_sig,2,1,true);

Inspeccionar datos mediante cursores
Para acceder al valor de una señal en un instante específico, puede añadir un cursor a la gráfica. Por ejemplo, la señal Sine parece tener un máximo local aproximadamente a los 6 segundos. Añada un cursor a la gráfica y observe el valor de la señal a los 6 segundos.
Simulink.sdi.setNumCursors(1)
Simulink.sdi.setCursorPositions("left",6)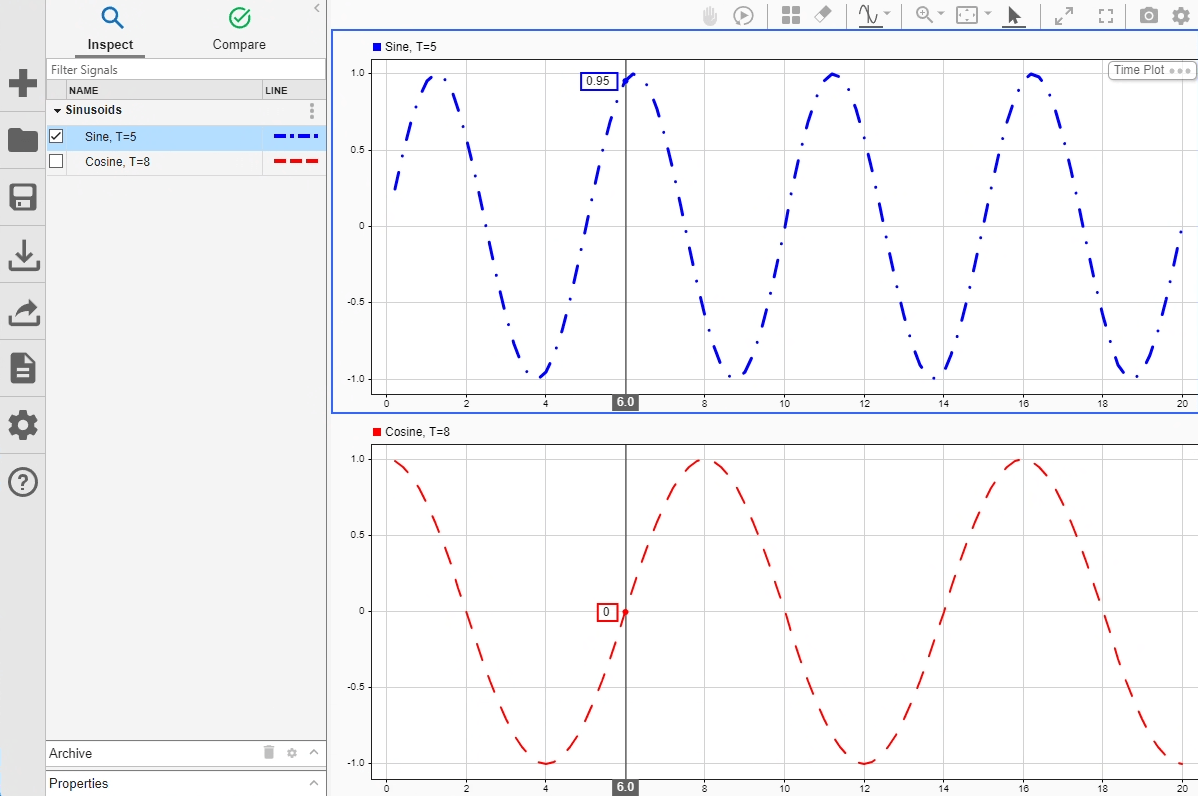
Coloque dos cursores en una gráfica para medir la diferencia de tiempo entre dos puntos o extraer estadísticas descriptivas dentro del intervalo definido.
Simulink.sdi.setNumCursors(2)
Simulink.sdi.setCursorPositions("left",5,"right",7)
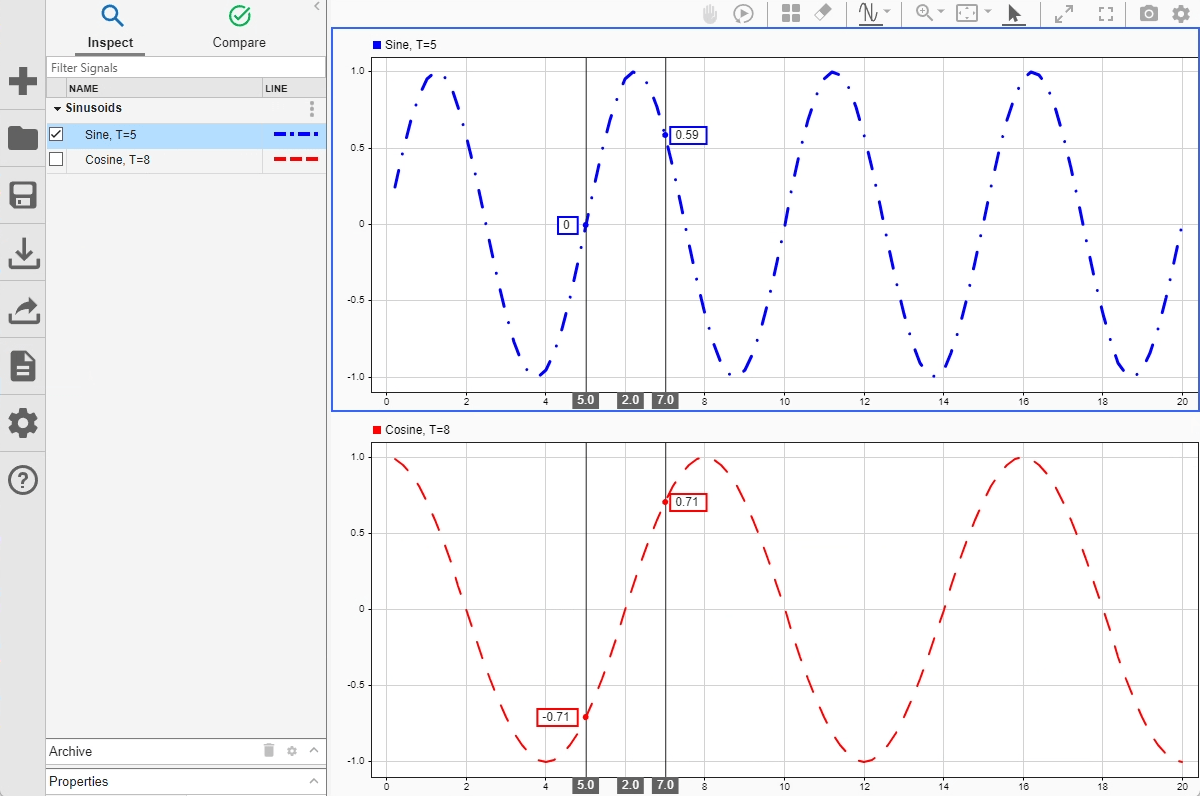
Determine el valor de muestreo máximo local de la señal Sine entre los cursores utilizando la función max.
[t1,t2] = Simulink.sdi.getCursorPositions;
localMax = max(sine_sig,t1,t2)
localMax =
0.9980
Cerrar Simulation Data Inspector y guardar los datos
Cuando termine de inspeccionar los datos de señales representados, puede cerrar Simulation Data Inspector y guardar la sesión en un archivo MLDATX.
Simulink.sdi.close("sinusoids.mldatx")Puede usar la función Simulink.sdi.plot para representar resultados de simulación en Simulation Data Inspector. Abra el modelo vdp, que modela la ecuación de Van der Pol diferencial de segundo orden. Para obtener más información sobre el modelo, consulte Van der Pol Oscillator.
mdl = "vdp";
open_system(mdl)
Simule el modelo. El modelo registra dos señales: x1 y x2. Los resultados de la simulación se almacenan en un solo objeto SimulationOutput denominado out.
out = sim(mdl);
Use la función Simulink.sdi.plot para abrir Simulation Data Inspector y representar los resultados.
Simulink.sdi.plot(out);

Puede utilizar la interfaz programática de Simulation Data Inspector para modificar un parámetro para la misma señal en múltiples ejecuciones. Este ejemplo añade una tolerancia absoluta de 0.1 a una señal en las cuatro ejecuciones de datos.
Primero, borre el área de trabajo y cargue la sesión de Simulation Data Inspector con los datos. La sesión incluye datos registrados de cuatro simulaciones de un modelo de Simulink® de un controlador longitudinal para una aeronave.
Simulink.sdi.clear
Simulink.sdi.load('AircraftExample.mldatx');
Utilice la función Simulink.sdi.getRunCount para obtener el número de ejecuciones en Simulation Data Inspector. Puede utilizar este número como índice para un bucle for que opere en cada ejecución.
count = Simulink.sdi.getRunCount;
Después, utilice un bucle for para asignar la tolerancia absoluta de 0.1 a la primera señal de cada ejecución.
for a = 1:count
    runID = Simulink.sdi.getRunIDByIndex(a);
    aircraftRun = Simulink.sdi.getRun(runID);
    sig = getSignalByIndex(aircraftRun,1);
    sig.AbsTol = 0.1;
end
Ejemplos relacionados
Parámetros
No hay parámetros disponibles para esta aplicación.