plotFuzzyClusters
Description
plotFuzzyClusters(
plots fuzzy clusters using input data data,U)data and fuzzy partition matrix
U. To compute U, first cluster the data using
the fcm function.
The plot contains an
Nf-by-Nf
array of axes, where Nf is the number of
features in data. In the plot:
Each data point is classified into the cluster for which the data point has the highest membership value.
The nondiagonal axes show 2-D plots for each pairwise feature combination.
The diagonal axes show the marginal cluster membership values of the data points with respect to each feature.
plotFuzzyClusters(
specifies options using one or more name-value arguments. For example,
data,U,Name=Value)plotFuzzyClusters(data,U,ClusterCenters=centers) plots the clustered
data along with the computed cluster centers specified by
centers.
Examples
Load the data to cluster. The three columns in clusterDemo correspond to the three features in the data.
load clusterDemo.datCluster the data into three clusters using the fcm function.
options = fcmOptions(...
    NumClusters=3,...
    Verbose=false);
[centers,U,objFun] = fcm(clusterDemo,options);
Plot the clusters using the fuzzy partition matrix.
plotFuzzyClusters(clusterDemo,U)
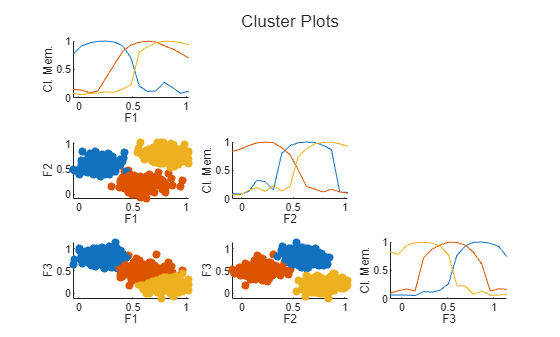
Because there are three features in the data, the plot shows a 3-by-3 grid of axes. The nondiagonal axes show the classified data points for each pair of features. The diagonal axes show the marginal cluster membership values across each feature range.
By default, plotFuzzyClusters plots each data point. Alternatively, you can interpolate the data points and create surface plots.
plotFuzzyClusters(clusterDemo,U,PlotType="surface")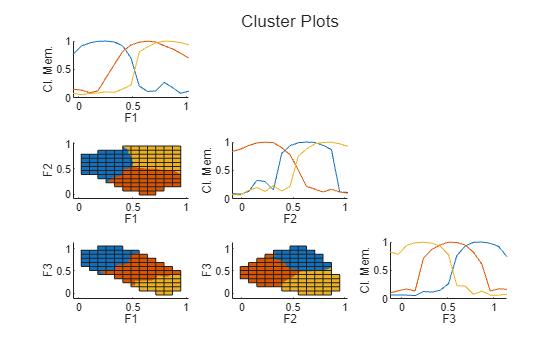
Load the data to be clustered.
load fcmdata.datCluster the data into two clusters.
options = fcmOptions(...
    NumClusters=2,...
    Verbose=false);
[centers,U] = fcm(fcmdata,options);
Plot the clustered data along with the cluster centers.
plotFuzzyClusters(fcmdata,U,ClusterCenters=centers)
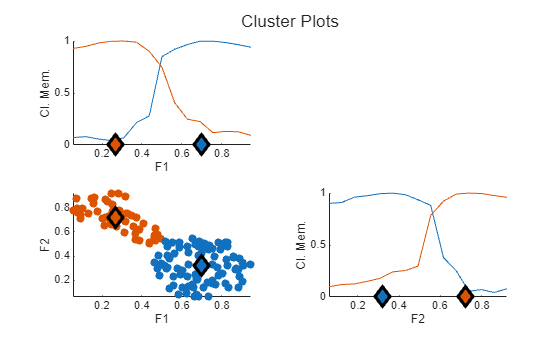
In each plot, the cluster centers are shown as diamonds.
Load the data to cluster. The three columns in clusterDemo correspond to the three features in the data.
load clusterDemo.datCluster the data into three clusters using the fcm function.
options = fcmOptions(...
    NumClusters=3,...
    Verbose=false);
[centers,U,objFun] = fcm(clusterDemo,options);
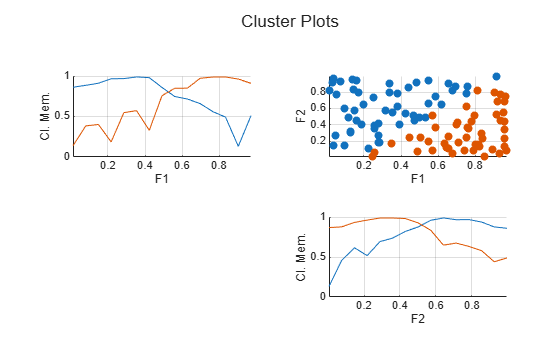
View the clustering results for the first and second features.
plotFuzzyClusters(clusterDemo,U,...
    SelectedFeatures=[1 2])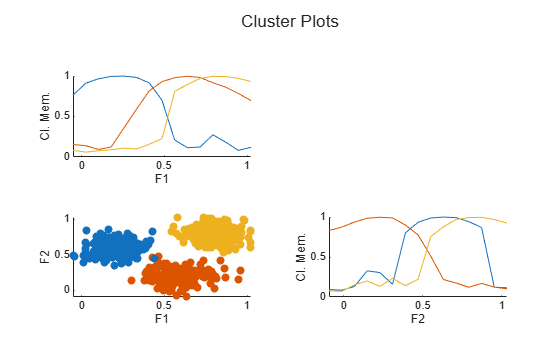
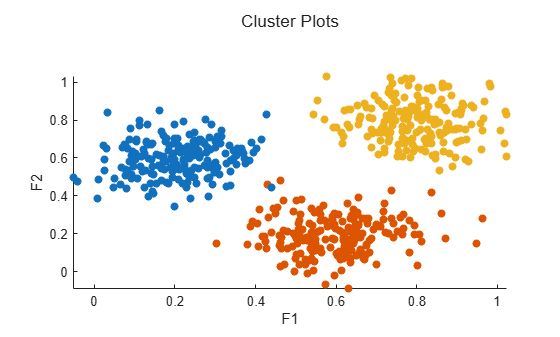
To expand the data plot, you can suppress the membership plots on the diagonal axes.
plotFuzzyClusters(clusterDemo,U,...
    SelectedFeatures=[1 2], ...
    ShowMembershipPlot=false)
Load the data to be clustered.
load fcmdata.datCluster the data into two clusters.
options = fcmOptions(...
    NumClusters=2,...
    Verbose=false);
[centers,U] = fcm(fcmdata,options);
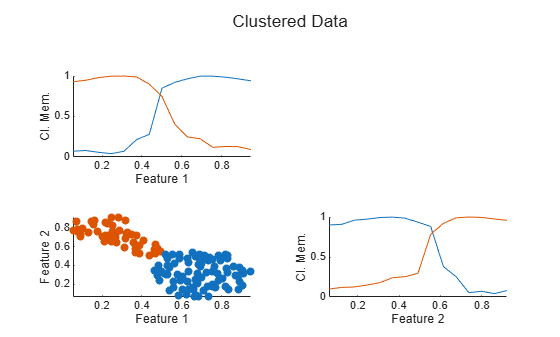
Plot the clustered specifying nondefault feature names and the plot title.
plotFuzzyClusters(fcmdata,U,...
    FeatureNames=["Feature 1", "Feature 2"], ...
    Title="Clustered Data")
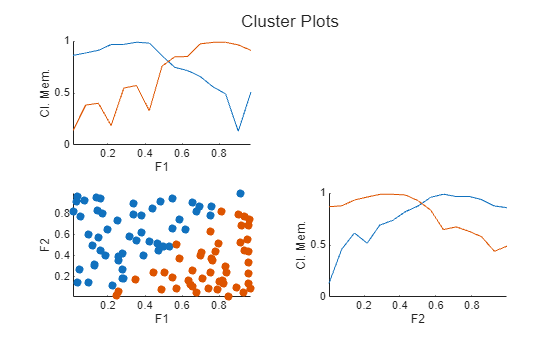
Load the data to cluster. For this example, create a random data set.
data = rand(100,2);
Cluster the data into two clusters.
options = fcmOptions(...
    NumClusters=2,...
    Verbose=false);
[centers,U] = fcm(data,options);
Plot the clusters and return a handle to the resulting tiled chart layout. For this example, suppress the cluster membership plots.
h = plotFuzzyClusters(data,U);
You can customize the plot by modifying its properties using the plot handle, which is useful when adding a fuzzy cluster plot to an App Designer app.
For this example, change the tile indexing to move the cluster plot to the upper triangular area.
h.TileIndexing = "columnmajor";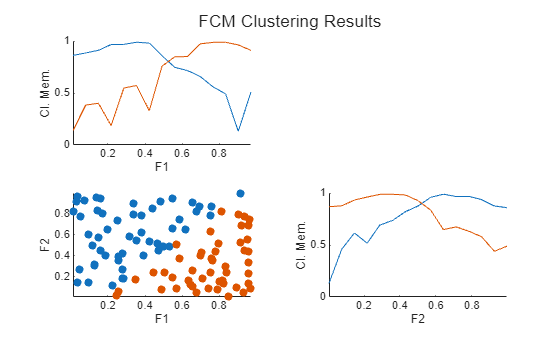
You can also modify the plot appearance using the plot handle. For example, add grid lines to each of the axes.
h.Children(1).XGrid = "on";
h.Children(1).YGrid = "on";
h.Children(2).XGrid = "on";
h.Children(2).YGrid = "on";
h.Children(3).XGrid = "on";
h.Children(3).YGrid = "on";