Create UTM Maps
The Universal Transverse Mercator (UTM) system divides the world into a set of quadrangles called zones. Each zone uses a transverse Mercator projection that is designed to limit distortion. Most zones cover 6 degrees of longitude. The UTM system is defined for latitudes between –80 and 84 degrees. Beyond these latitudes, use the Universal Polar Stereographic (UPS) system, instead.
Mapping Toolbox™ functions identify zones using zone numbers from 1 to 60. The functions use different conventions to identify regions within the zones.
For
projcrsobjects created from EPSG codes, zone numbers with hemisphere letters indicate either the northern or southern hemisphere. The image shows zone 39N in yellow and zone 39S in purple.For
axesm-based maps, theutmzonefunction, and theutmzoneuifunction, zone numbers indicate zones across both the northern and southern hemispheres. Zone numbers with latitude band letters indicate regions that, in most cases, cover 8 degrees of latitude. Some zones in northern Europe cover more or less than 6 degrees of longitude. The image shows zone 19 in blue and zone 18Q in orange.

This topic shows how to create similar maps using map
axes (since R2023a) and axesm-based maps. For a comparison of map axes and
axesm-based maps, including when to use each type of display, see Choose a 2-D Map Display.
Create UTM Map Using Map Axes
Read a shapefile of US states into the workspace as a geospatial table. The shapefile represents the states using polygon shapes in geographic coordinates.
states = readgeotable("usastatelo.shp");Create a subtable that includes New York and the states that comprise New England: Maine, New Hampshire, Vermont, Massachusetts, Connecticut, and Rhode Island.
names = ["New York","Maine","New Hampshire","Vermont","Massachusetts", ...
    "Connecticut","Rhode Island"];
NEstates = geocode(names,states);
Display Data in Zone and Surrounding Area
Create a projected coordinate reference system (CRS) object that is appropriate for New England. Use the NAD83 / UTM zone 19N projected CRS, which has the EPSG code 26919. For this CRS, zone 19N indicates zone 19 in the northern hemisphere.
proj = projcrs(26919);
Create a new map that uses the projected CRS. Then, plot the states.
figure
newmap(proj)
geoplot(NEstates)

Display Only Data in Zone
By default, the map displays data in the box specified by the Position property of the axes object. As a result, the map can display data within the UTM zone and in the surrounding longitudes. To display data within only the UTM zone, use a cartographic map layout.
Create a new map that uses the same projected CRS.
figure
mx = newmap(proj);
Get the cartographic latitude and longitude limits of the CRS. Then, clip the states to the limits.
latlim = mx.CartographicLatitudeLimits;
lonlim = mx.CartographicLongitudeLimits;
clipped = geoclip(NEstates.Shape,latlim,lonlim);
Display the clipped shapes on the map. Then, change the map layout to cartographic.
geoplot(clipped)
mx.MapLayout = "cartographic";
Create UTM Map Using axesm-Based Maps
Read a shapefile of US states into the workspace as a geospatial table. The shapefile represents the states using polygon shapes in geographic coordinates.
states = readgeotable("usastatelo.shp");Create a subtable that includes New York and the states that comprise New England: Maine, New Hampshire, Vermont, Massachusetts, Connecticut, and Rhode Island.
names = ["New York","Maine","New Hampshire","Vermont","Massachusetts" ...
    "Connecticut","Rhode Island"];
NEstates = geocode(names,states);
Create an axesm-based map for UTM zone 19T. Specify the reference ellipsoid as the Geodetic Reference System 1980 (GRS 80). Turn on the grid and parallel labels, and remove the axes lines.
figure
axesm("utm",Zone="19T",Geoid=referenceEllipsoid("grs80"))
gridm
plabel
axis off
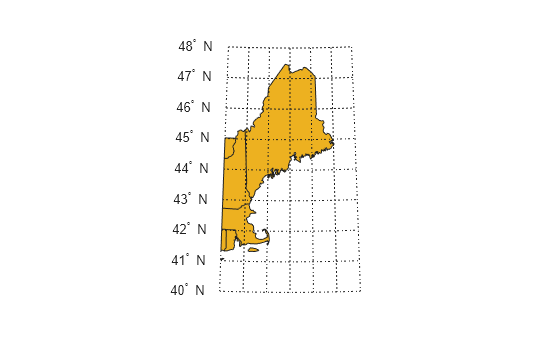
Display the shapes on the map. By default, the map uses the limits for the UTM zone.
geoshow(NEstates)