Customize Appearance of Vector Basemaps
Add custom vector basemaps from map tiles hosted by Esri® or from MBTiles files by using the addCustomBasemap function. You can customize the appearance of vector basemaps, such as the colors and fonts, by specifying a style. There are several ways to specify a style for vector basemaps.
Use a predefined style — Predefined styles are convenient and do not require internet access.
Use a style URL — Style URLs enable you to use visual elements that are not available with predefined styles.
Use a JSON file — JSON files are customizable and enable you to use visual elements that are not available with predefined styles.
Edit a predefined style — Editing a predefined style is available for vector basemaps added from MBTiles files.
Use a Predefined Style
Specify the appearance of a custom vector basemap by using a predefined style. Predefined styles are convenient and do not require internet access. For a list of predefined style options, see the Style name-value argument on the addCustomBasemap page.
Create a basemap from an MBTiles file containing vector map tiles. Specify a predefined style that uses colors based on OpenStreetMap®.
basemapName1 = "osmstyle";
addCustomBasemap(basemapName1,"naturalearth.mbtiles",Style="openstreetmap")
Use the basemap to create a map of Germany.
figure
geobasemap(basemapName1)
geolimits([47.2 54.2],[1.50 19.01])

Use a URL
Specify the appearance of a custom vector basemap by using a URL. Styles defined by URLs enable you to use visual elements that are not available with predefined styles, for example, textures and additional fonts.
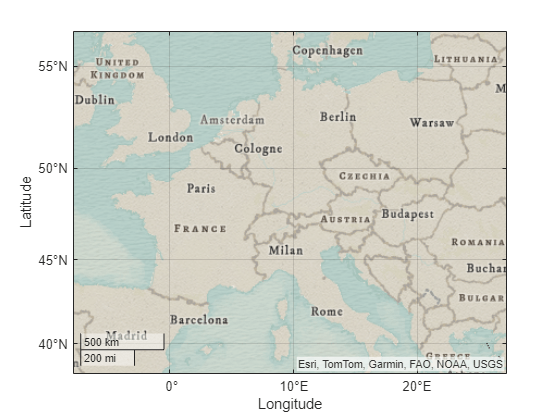
Create a basemap using the map tiles URL and style URL for Modern Antique [1].
basemapName2 = "antiquestyle";
url2 = "https://basemaps.arcgis.com/arcgis/rest/services/" + ...
    "World_Basemap_v2/VectorTileServer/tile/${z}/${x}/${y}.pbf";
style2 = "https://www.arcgis.com/sharing/rest/content/items/" + ...
    "effe3475f05a4d608e66fd6eeb2113c0/resources/styles/root.json?f=pjson";
addCustomBasemap(basemapName2,url2,Style=style2)
Use the basemap to create a map of Germany.
figure
geobasemap(basemapName2)
geolimits([47.2 54.2],[1.50 19.01])
Use a JSON file
Specify the appearance of a custom vector basemap by using a JSON file. Styles defined by JSON files are customizable and enable you to use visual elements that are not available with predefined styles. For an example of how to edit JSON style files, see Edit a predefined style.
Create a basemap from an MBTiles file containing vector map tiles. Specify the style using a sample JSON file that emphasizes roads and transit networks.
basemapName3 = "streetstyle";
addCustomBasemap(basemapName3,"naturalearth.mbtiles",Style="streetstyle.json")
Use the basemap to create a map of Germany.
figure
geobasemap(basemapName3)
geolimits([47.2 54.2],[1.50 19.01])

Edit a Predefined Style
When you create a custom vector basemap using an MBTiles file and a predefined style, the addCustomBasemap function generates a JSON file that defines the style for the basemap. You can customize the appearance of a predefined style by editing the JSON file and then adding the basemap again. This example shows how to manually edit the JSON file using a text editor. Alternatively, if you have access to a visual style editor, you can customize the style interactively.
The addCustomBasemap function places the JSON file in the same folder as the MBTiles file. Prepare for the example by copying an MBTiles file containing vector map tiles to a writable location, in this case, the working directory for the example.
mbtilesFilename = "naturalearth.mbtiles";
if ~isfile(mbtilesFilename)
    mbtilesFullPath = fullfile(matlabroot,"toolbox","map","mapdata",mbtilesFilename);
    copyfile(mbtilesFullPath)
end
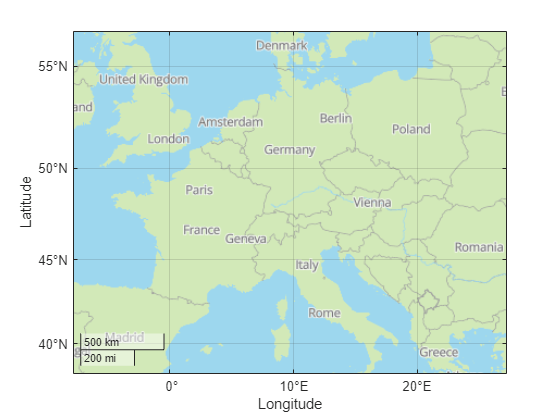
Create a basemap from the MBTiles file. Specify a predefined style that uses light blue for water areas and light green for land areas.
basemapName4 = "bluegreenstyle";
addCustomBasemap(basemapName4,"naturalearth.mbtiles",Style="bluegreen")
Use the basemap to create a map of Germany.
figure
geobasemap(basemapName4)
geolimits([47.2 54.2],[1.50 19.01])
The addCustomBasemap function names the JSON file using the name of the MBTiles file and the name of the style, in this case, naturalearth_bluegreen.json. Open the file in a text editor. To programmatically open the file in the MATLAB® Editor, uncomment this code.
% edit("naturalearth_bluegreen.json")The JSON file follows the Mapbox GL JS Style Specification [2]. Update the JSON file by making these changes:
Background color — Find the layer that specifies the appearance of the background (
"id": "background"). Change the background color to light orange by specifying the"fill-color"property as"#f2de96".Land color — Find the layer that specifies the appearance of land areas (
"id": "land"). Change the land color to light orange by specifying"fill-color"as"#f2de96".Ocean color — Find the layer that specifies the appearance of ocean areas (
"id": "ocean"). Change the ocean color to a different shade of blue by specifying"fill-color"as"#add8e6".Country boundary width — Find the layer that specifies appearance of country boundaries [3] (
"id": "admin0_boundary"). The"line-width"property specifies line widths at different zoom levels. For example, at zoom level4, the file specifies the line width as1.5pixels. Use thicker lines by specifying2pixels.Size of place markers — Find the layer that specifies the appearance of circle markers for high-importance places (
"id": "high_importance_places_circles"). Change the radius of the markers by specifying the"circle-radius"property as4.Size of place labels — Find the layer that specifies the appearance of text labels for populated places (
"id": "high_importance_places"). The"text-size"property specifies the text size at different zoom levels. For example, at zoom level2, the text size11pixels. Use larger text by specifying13pixels.
Save the updates to a new JSON file. This example includes the updates in the supporting file naturalearth_blueorange.json.
Add a custom basemap that uses the updated style by using the addCustomBasemap function.
basemapName5 = "blueorangestyle";
addCustomBasemap(basemapName5,mbtilesFilename,Style="naturalearth_blueorange.json")
View the updated basemap by creating a new map of Germany.
figure
geobasemap(basemapName5)
geolimits([47.2 54.2],[1.50 19.01])

[1] "Modern Antique - Overview." ArcGIS Online. Accessed December 8, 2022. https://www.arcgis.com/home/item.html?id=effe3475f05a4d608e66fd6eeb2113c0.
[2] "Style Specification | Mapbox GL JS | Mapbox." Mapbox. Accessed December 8, 2022. https://docs.mapbox.com/mapbox-gl-js/style-spec/.
[3] Alignment of boundaries and region labels are a presentation of the feature provided by the data vendors and do not imply endorsement by MathWorks®.