ingeoquad
True for points inside or on lat-lon quadrangle
Syntax
tf = ingeoquad(lat, lon, latlim, lonlim)
Description
tf = ingeoquad(lat, lon, latlim, lonlim)
returns
an array tf
that has the same size as lat
and lon
.
tf(k)
is true if and only if the point lat(k)
, lon(k)
falls
within or on the edge of the geographic quadrangle defined by latlim
and lonlim
.
latlim
is a vector of the form [southern-limit
northern-limit]
, and lonlim
is a vector
of the form [western-limit eastern-limit]
. All
angles are in units of degrees.
Examples
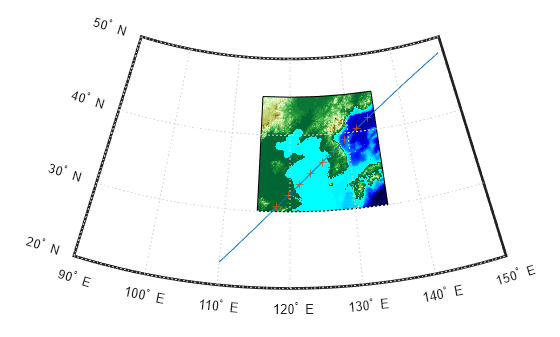
Load elevation data and a geographic cells reference object for the Korean peninsula. Display the data on a world map. Apply a colormap appropriate for elevation data using
demcmap
.load korea5c figure('Color','white') worldmap([20 50],[90 150]) geoshow(korea5c,korea5cR,'DisplayType','texturemap'); demcmap(korea5c)
Outline the quadrangle containing the elevation data:
[outlineLat, outlineLon] = outlinegeoquad(korea5cR.LatitudeLimits, ... korea5cR.LongitudeLimits,90,5); geoshow(outlineLat,outlineLon,'DisplayType','line', ... 'Color','k')
Generate a track that crosses the elevation data:
[lat,lon] = track2(23,110,48,149,[1 0],'degrees',20); geoshow(lat,lon,'DisplayType','line')
Identify and mark points on the track that fall within the quadrangle outlining the elevation data:
tf = ingeoquad(lat,lon,korea5cR.LatitudeLimits, ... korea5cR.LongitudeLimits); geoshow(lat(tf),lon(tf),'DisplayType','point')
Version History
Introduced in R2008a