pareto
Pareto chart
Syntax
Description
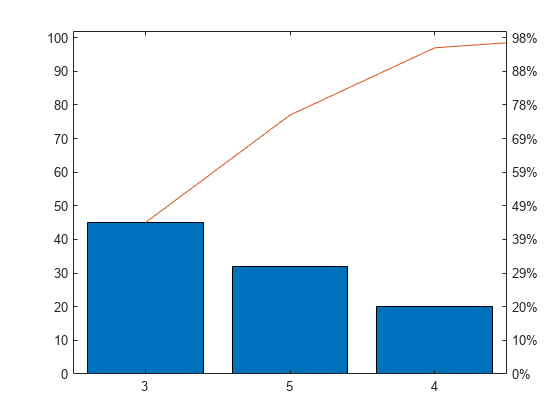
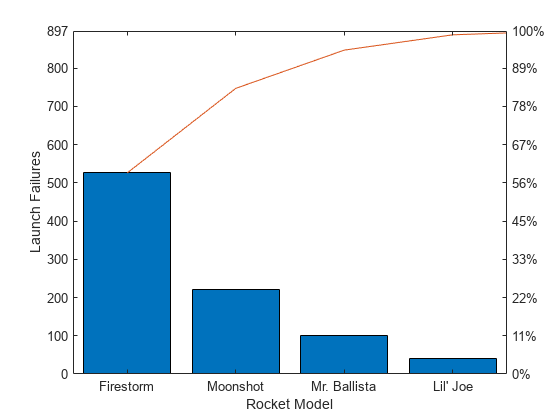
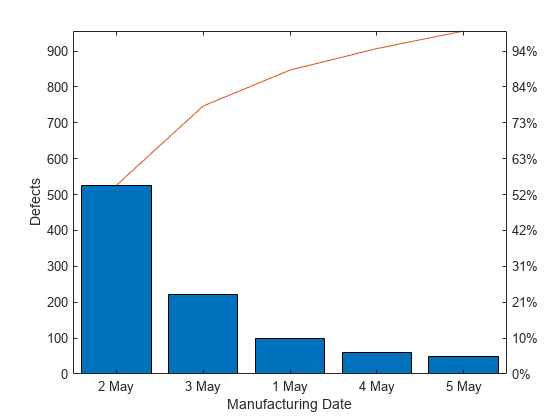
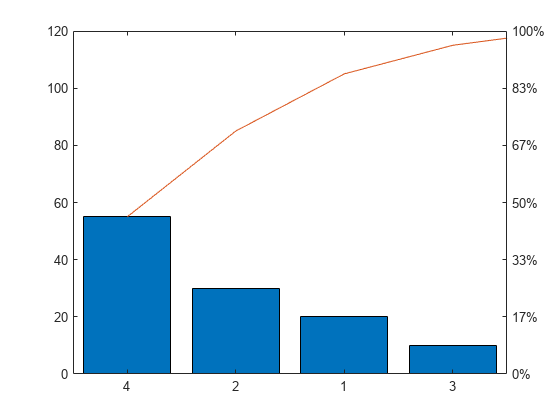
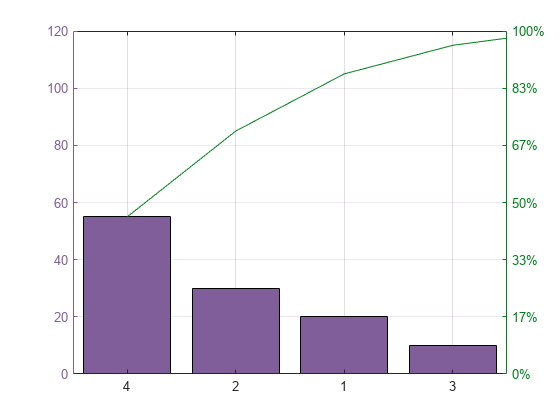
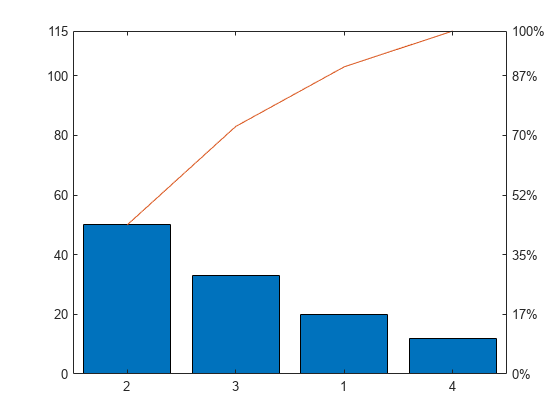
pareto( creates a Pareto chart of
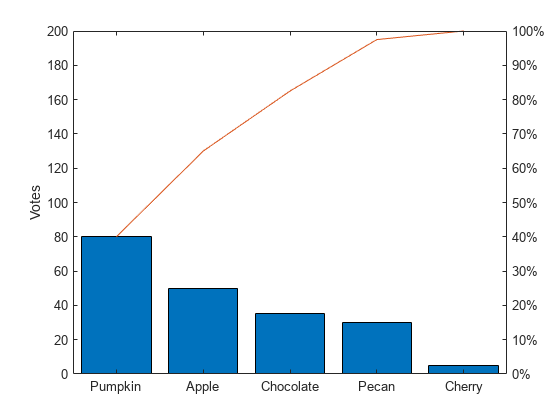
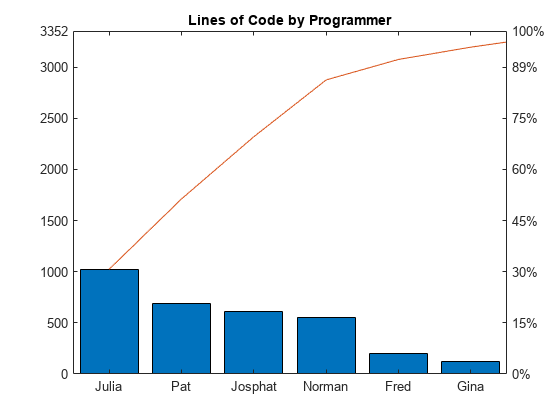
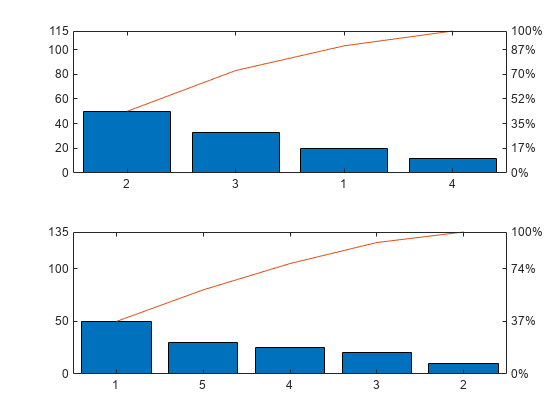
y)y. A Pareto chart is a bar chart with the bars sorted in descending
order, and it includes a line that shows the cumulative distribution. The chart displays the
tallest bars that comprise 95% of the cumulative distribution, up to a maximum of
10 bars. If n bars contain exactly 95% of the
distribution, and n is less than 10, the chart
displays n+1 bars.
The bar labels along the x-axis are the indices to the bar values in
the y vector.
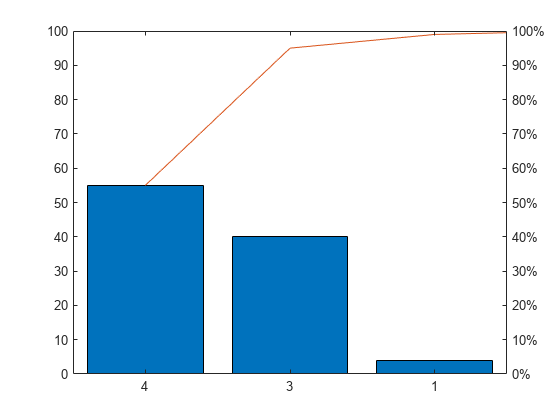
pareto(___, specifies a
threshold value between threshold)0 and 1. The threshold is the
fraction of the cumulative distribution to include in the chart. The chart includes the
tallest bars that comprise that fraction, up to a maximum of 10 bars. If
n bars contain exactly the specified fraction, and n
is less than 10, the chart displays n+1 bars.
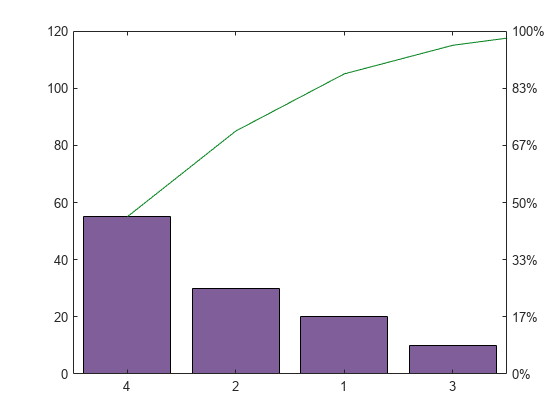
charts = pareto(___)Bar and Line objects in an array. You can use the
objects to modify aspects of the Pareto chart by setting properties. For a list of
properties, see Bar Properties and Line Properties.
[charts,ax] = pareto(___) returns an array of two
Axes objects in addition to the objects in the
charts array. You can use these objects to modify aspects of the chart
by setting properties. For a list of properties, see Axes Properties, Bar Properties, and Line Properties.
Examples
Input Arguments
Extended Capabilities
Version History
Introduced before R2006a
