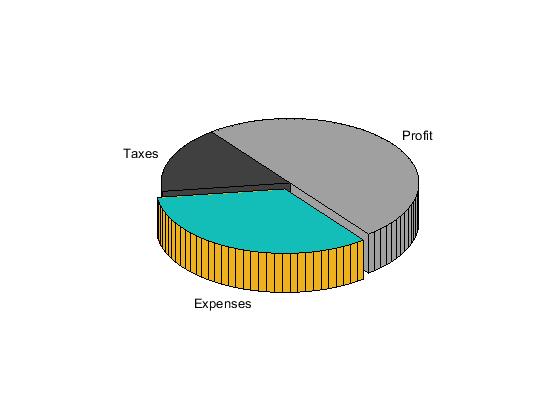
pie3
3-D pie chart
Description
pie3( draws a three-dimensional pie chart
using the data in X)X. Each slice of the pie chart represents an element in
X.
pie3( plots into the axes
specified by ax,___)ax instead of into the current axes
(gca). The argument ax can precede any of the input
argument combinations in the previous syntaxes.
p = pie3(___)Patch, Surface, and Text
objects that make up the pie chart. Use p to modify properties of the
chart after creating it. For a list of properties you can set for these objects, see
Patch Properties, Surface Properties, and Text Properties.


