Main Content

generatePlotParameters

Parameters for plotSection

Description

example

plotParams = generatePlotParameters(empcobj) creates a structure of parameters for a 2-D sectional plot of the explicit MPC control law of the explicit MPC controller, empcobj. You set the fields of this structure and use it to generate the plot using the plotSection command.

Examples

collapse all

Define a double integrator plant model and create a traditional implicit MPC controller for this plant. Constrain the manipulated variable to have an absolute value less than 1.

plant = tf(1,[1 0 0]);
mpcobj = mpc(plant,0.1,10,3);
-->"Weights.ManipulatedVariables" is empty. Assuming default 0.00000.
-->"Weights.ManipulatedVariablesRate" is empty. Assuming default 0.10000.
-->"Weights.OutputVariables" is empty. Assuming default 1.00000.
mpcobj.MV = struct('Min',-1,'Max',1);

Define the parameter bounds for generating an explicit MPC controller.

range = generateExplicitRange(mpcobj);
-->Converting the "Model.Plant" property to state-space.
-->Converting model to discrete time.
   Assuming no disturbance added to measured output #1.
-->"Model.Noise" is empty. Assuming white noise on each measured output.
range.State.Min(:) = [-4;-4];
range.State.Max(:) = [ 4; 4];
range.Reference.Min(:) = -2;
range.Reference.Max(:) = 2;
range.ManipulatedVariable.Min(:) = -1.1;
range.ManipulatedVariable.Max(:) = 1.1;

Create an explicit MPC controller.

empcobj = generateExplicitMPC(mpcobj,range);
Regions found / unexplored:       19/       0

Create a default plot parameter structure, which specifies that all of the controller parameters are fixed at their nominal values for plotting.

plotParams = generatePlotParameters(empcobj);

Allow the controller states to vary when creating a plot.

plotParams.State.Index = [];
plotParams.State.Value = [];

Fix the manipulated variable and reference signal to 0 for plotting.

plotParams.ManipulatedVariable.Index(1) = 1;
plotParams.ManipulatedVariable.Value(1) = 0;
plotParams.Reference.Index(1) = 1;
plotParams.Reference.Value(1) = 0;

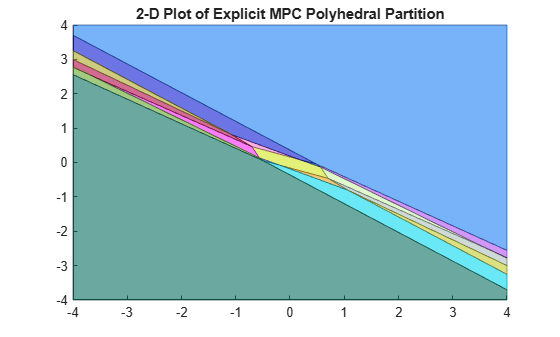
Generate the 2-D section plot for the explicit MPC controller.

plotSection(empcobj,plotParams)

ans = 
  Figure (1: PiecewiseAffineSectionPlot) with properties:

      Number: 1
        Name: 'PiecewiseAffineSectionPlot'
       Color: [1 1 1]
    Position: [348 376 583 437]
       Units: 'pixels'

  Use GET to show all properties

Input Arguments

collapse all

Explicit MPC controller for which you want to create a 2-D sectional plot, specified as an Explicit MPC controller object. Use generateExplicitMPC to create an explicit MPC controller.

Output Arguments

collapse all

Parameters for sectional plot of explicit MPC control law, returned as a structure.

As returned by generatePlotParameters, the plotParams structure command fixes all the control law’s parameters at their nominal values. To obtain the desired plot, eliminate the Index and Value entries of the two parameters forming the plot axes, and modify fixed values as necessary. Then, use the plotSection command to display the 2-D sectional plot of the explicit control law’s PWA regions with the remaining free parameters as the x and y axes.

The fields of the plot-parameters structure are as follows.

Fixed controller states, specified as a structure having an Index field and a Value field. The field plotParams.State.Index is a vector that contains the indices of the controller states to fix for the plot, and plotParams.State.Value contains the corresponding constant state values.

Modify the default value of plotParams.State to generate the desired plot. See Specify Fixed Parameters for 2-D Plot of Explicit Control Law.

Fixed reference signal values, specified as a structure having an Index field and a Value field. The field plotParams.Reference.Index is a vector that contains the indices of the reference signals to fix for the plot, and plotParams.Reference.Value contains the corresponding constant reference signal values.

Modify the default value of plotParams.Reference to generate the desired plot. See Specify Fixed Parameters for 2-D Plot of Explicit Control Law.

Fixed measured disturbance values, specified as a structure having an Index field and a Value field. The field plotParams.MeasuredDisturbance.Index is a vector that contains the indices of the measured disturbances to fix for the plot, and plotParams.MeasuredDisturbance.Value contains the corresponding constant measured disturbance values.

Modify the default value of plotParams.MeasuredDisturbance to generate the desired plot. See Specify Fixed Parameters for 2-D Plot of Explicit Control Law.

Fixed manipulated variable values, specified as a structure having an Index field and a Value field. The field plotParams.ManipulatedVariable.Index is a vector that contains the indices of the manipulated variables to fix for the plot, and plotParams.ManipulatedVariable.Value contains the corresponding constant manipulated variable values.

Modify the default value of plotParams.ManipulatedVariable to generate the desired plot. See Specify Fixed Parameters for 2-D Plot of Explicit Control Law.

Version History

Introduced in R2014b