Load and View Multi-Sensor Data
R2026bThe Multi-Sensor Labeler app provides options for labeling two types of signals.
Image signals are image-based. You can load these signals from sources such as videos, image sequences, ROS or ROS 2 bag files.
Point cloud signals are lidar-based. You can load these signals from sources such as a sequence of point cloud files, Velodyne PCAP, E57, Hesai, Ouster, LAS/LAZ files, ROS or ROS 2 bag files, and other formats.
A data source is a file or folder that you load into the app, such
as a video file, an image folder, or a ROS or ROS 2 bag. Each source contains one or more
signals — the actual data streams you label. For most source
types, one source produces one signal. However, some sources can produce multiple signals.
For example, a ROS bag or ROS 2 bag file containing two sensor_msgs/Image
topics and four sensor_msgs/PointCloud2 topics is one source that
produces up to six separate signals.
In a typical workflow, you load time-synchronized signals from multiple sensors representing the same scene and label them simultaneously. For example, you might load a video from a front-facing camera and a point cloud sequence from a roof-mounted lidar sensor.
Open the Multi-Sensor Labeler App
To open the Multi-Sensor Labeler app, at the MATLAB® command prompt, enter this command.
multiSensorLabeler
The app opens to an empty session.
Alternatively, you can open the app from the Apps tab of the MATLAB toolstrip, under Image Processing and Computer Vision.
Load Timestamps
If you have timestamps stored in a separate file for your point cloud or image
sequence data, load them into the MATLAB workspace before importing the signals. The
timestamps must be a duration vector.
For this example, load the timestamps for a point cloud sequence. The timestamps are in the same folder as the sequence. To load the timestamps, you must temporarily add this folder to the MATLAB search path.
pcSeqFolder = fullfile(toolboxdir('pointcloud'),'pcdata','lidarSequence');
addpath(pcSeqFolder)
load timestamps.mat
rmpath(pcSeqFolder)
Timestamps are optional for video sources. When you load a video, the app can read the timestamps directly from the video file.
Open the Multi-Sensor Labeler App
To open the Multi-Sensor Labeler app, at the MATLAB command prompt, enter this command.
multiSensorLabeler
The app opens to an empty session.
Alternatively, you can open the app from the Apps tab of the MATLAB toolstrip, under Image Processing and Computer Vision.
Load Timestamps
If you have timestamps stored in a separate file for your point cloud or image
sequence data, load them into the MATLAB workspace before importing the signals. The
timestamps must be a duration vector.
For this example, load the timestamps for a point cloud sequence. The timestamps are in the same folder as the sequence. To load the timestamps, you must temporarily add this folder to the MATLAB search path.
pcSeqFolder = fullfile(toolboxdir('pointcloud'),'pcdata','lidarSequence');
addpath(pcSeqFolder)
load timestamps.mat
rmpath(pcSeqFolder)
Timestamps are optional for video, Velodyne, Hesai and Ouster sources. When you load those sources, the app can read the timestamps directly from the file.
Import Image Signals
To import image signals, on the app toolstrip, click Import > Add Signals. The Add/Remove Signal dialog box opens.
Load Video
Load a video into the app.
In the Add/Remove Signal dialog box, set the Source Type parameter to
Videoand the Timestamps parameter toFrom File.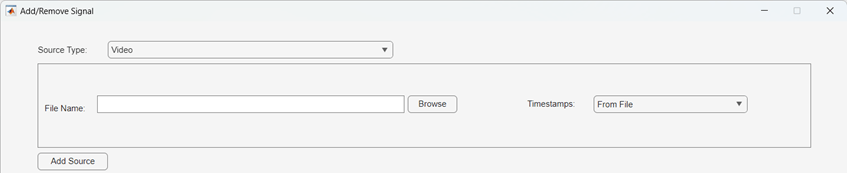
In the File Name parameter, browse for the video file to load.
<matlabroot>is the full path to your MATLAB installation folder, as returned by thematlabrootfunction.<matlabroot>\toolbox\pointcloud\pcdata\01_city_c2s_fcw_10s.mp4
Click Add Source. The video loads into the app, and the app reads the timestamps directly from the video. The source table displays the information about the video data source.
Load Image Sequence
Alternatively, follow these steps to load an image sequence:
Set the Source Type parameter to
Image Sequence.In the Folder Name parameter, browse for the folder containing the image files.
Specify the timestamps for the image sequence. Set the Timestamps parameter to
From
                                Workspace
and select the timestamps variable from the workspace, or set it toUse Default.Click Add Source. The image sequence loads into the app.
You can also load an image sequence programmatically by specifying it when opening the app:
multiSensorLabeler(imageFolder,timestamps)
Load Custom Image
Set Source Type to Custom Image.
Specify the Custom Reader Function, Source
Name, and Timestamps parameters.
Import Point Cloud Signals
To import point cloud signals, on the app toolstrip, click Import > Add Signals. The Add/Remove Signal dialog box opens.
Point Cloud
                                Sequence
To load a point cloud sequence:
In the Add/Remove Signal dialog box, set the Source Type parameter to
Point Cloud Sequence.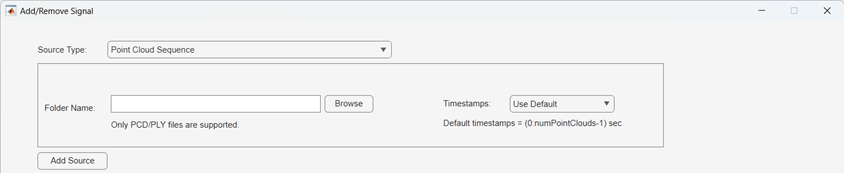
To specify Folder Name parameter, select Browse and navigate to the folder that contains the sequence of point cloud data (PCD) files you want to load and click Select Folder.
<matlabroot>\toolbox\pointcloud\pcdata\lidarSequence
To specify timestamps using a MATLAB workspace variable, set the Timestamps parameter to
From
                                Workspace
and, in the Import From Workspace dialog box, select a variable with thedurationdata type and click OK. Otherwise, set Timestamps toUse Default.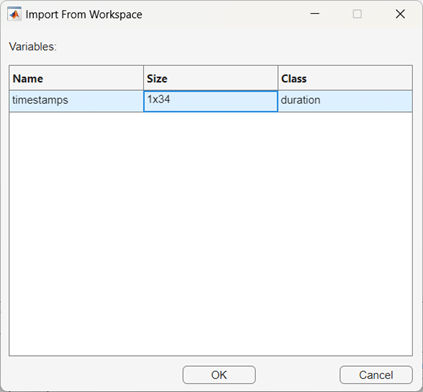
Click OK. The app loads the specified point cloud sequence and reads the timestamps from the
timestampsvariable. The source table displays the information about the data source for the point cloud sequence.
Note
When Source Type is Point Cloud
Sequence, the app reads point cloud frames lexicographically,
where the arrangement of characters, words, or numbers is in alphabetical
order.
Other Formats
You can also import point cloud data from these additional source types. For each format, set the Source Type parameter to the corresponding option in the Add/Remove Signal dialog box.
Import from Workspace
You can open the Multi-Sensor Labeler app with data already loaded by passing a ground truth object from the MATLAB workspace. The app accepts these object types:
groundTruthMultiSensor— The current multi-sensor ground truth object.groundTruthMultisignal(Automated Driving Toolbox) — A legacy multi-signal ground truth object from the Ground Truth Labeler app.groundTruthLidar— A legacy point cloud ground truth object from the Lidar Labeler app.
For example, to load an existing ground truth object:
multiSensorLabeler(gTruth)
Note
Support for loading legacy groundTruthMultisignal (Automated Driving Toolbox) and groundTruthLidar objects exported from Ground Truth
Labeler and Lidar Labeler apps will be removed in a future
release. To preserve your work, load the groundTruthMultisignal
and groundTruthLidar objects in the Multi-Sensor
Labeler app and export them as groundTruthMultiSensor objects.
Import Legacy Ground Truth Labeler and Lidar Labeler Sessions
Note
Support for loading legacy Ground Truth Labeler and Lidar Labeler session files will be removed in a future release. To preserve your work, open the legacy sessions in the Multi-Sensor Labeler app and save them as a project file.
The Multi-Sensor Labeler app can load existing session files from both the Ground Truth Labeler and Lidar Labeler apps:
Ground Truth Labeler sessions — Load
.prjproject files or.matsession files. The app preserves all label definitions and labeled data.Lidar Labeler sessions — Load
.matsession files. The app preserves all label definitions, including Semantic Point ROI (formerly Voxel ROI) labels, and labeled data.
To load a legacy session, use the multiSensorLabeler command with
the path to the session file:
multiSensorLabeler(sessionFilePath)
For more details on migrating from the Ground Truth Labeler or Lidar Labeler, see Migrate from Ground Truth Labeler and Lidar Labeler Apps to Multi-Sensor Labeler App.
Verify Signal Information
The table at the bottom of the Add/Remove Signal dialog box displays information about the loaded signals. Verify that the table displays this information for the loaded signals.
The Signal Name column displays the signal names generated by the app. For a video, the signal name is the file name of the data source with the prefix
video_and with no file extension. For a point cloud sequence, the signal name is the name of the source folder.The Source column displays the full file paths to the signal data sources.
The Signal Type column displays the type of each signal. Videos and image sequences are of type
Image. Point cloud sequences are of typePoint Cloud.The Time Range column displays the duration of the signals based on the loaded timestamp data.
When loading multiple signals from different sensors, verify that the time ranges overlap sufficiently for simultaneous labeling. The app time-aligns signals based on their timestamps.
After verifying that the signals loaded correctly, click OK. The app loads the signals and opens to the first frame of the last signal added.
Configure Signal Display
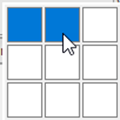
When you first load the signals, the app displays only one signal at a time. To display the signals side-by-side, first, on the Labeler tab of the app toolstrip, in the Layout section, click Grid. Then, move the pointer to select a grid layout (for example, 1-by-2 for two signals) and click the grid.
The video and point cloud sequence display side-by-side.
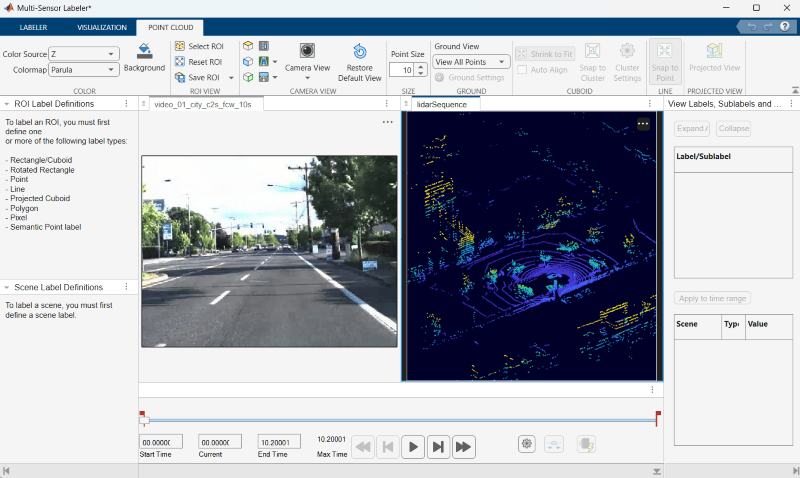
To view the signals together, in the slider below the signals, click the Play button. By default, the app assigns the signal with the highest frame rate as the main signal and plays all its frames. For all other signals, the app displays the frame that is time-aligned with the currently displaying frame of the main signal. When navigating between frames, frames from signals with lower frame rates are sometimes repeated.
To configure which signal is the main signal, open the Playback Control Settings dialog box by clicking the gear icon below the slider. In the dialog, you can also select All timestamps to display frames from all signals, or specify a custom timestamp vector from the workspace.
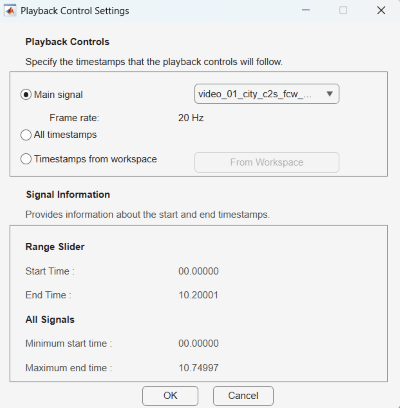
For more details on how main signal selection affects frame display and automation, see Control Playback of Signal Frames for Labeling.
Visualize Point Cloud Data
On the Point Cloud tab of the app toolstrip, you can configure color options, ROI limits, camera views, point size, and ground segmentation settings for the selected point cloud signal.
Note
When you have multiple signals loaded, click a signal in the display to select it for tuning visualization parameters. The settings you configure on the Point Cloud , Semantic Point and Visualization tabs affect only the selected signal — each signal maintains its own visualization settings independently.
Color Controls
Choose color options to control the display of the point cloud.
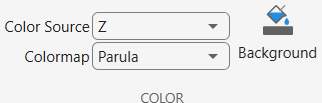
Choose the color source for the point cloud data from these options:
Single Color— Display all points in a uniform color. This is the default.X— Map colors based on the x-coordinate of each point.Y— Map colors based on the y-coordinate of each point.Z— Map colors based on the height (z-coordinate) of each point.True Color— Display the point cloud using the RGB color data associated with each point. The app enables this option only when the loaded point cloud data has color information.Intensity— Display the point cloud using the intensity data associated with each point. The app enables this option only when the loaded point cloud data has intensity information.Row— Map colors based on the row index of each point in the organized point cloud. The app enables this option only when the loaded point cloud is organized.Column— Map colors based on the column index of each point in the organized point cloud. The app enables this option only when the loaded point cloud is organized.
ROI View Options
Choose options to select, reset, or save a region of interest (ROI) for the point cloud data.
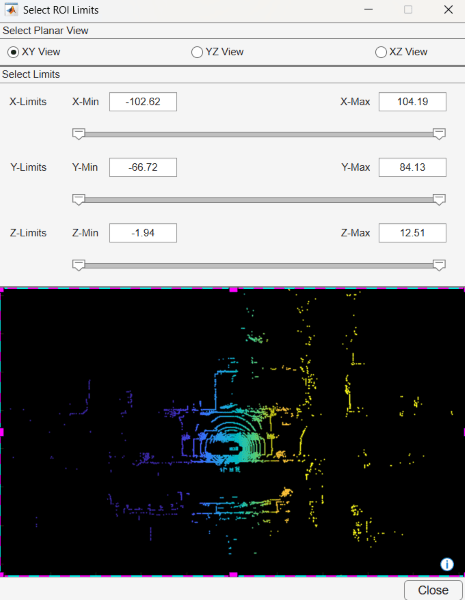
Click Select ROI to define and view a region of interest (ROI) in the point cloud.
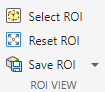
The app opens the Adjust ROI Limits dialog box, which contains the ROI parameters. Specify the x-, y-, and z-axes limits for the ROI. The dialog box also visualizes the rectangular ROI on the xy-axes of a point cloud. You can also adjust x- and y-limits for the ROI by dragging and resizing the rectangle on the xy-plane.

To save the selected ROI, click Save ROI. The app opens the Save ROI View dialog box. Enter a name for the ROI view and click OK.

To view a previously saved ROI, from the Save ROI list, select the desired view.
Camera View Options
Use these camera options to view, adjust, and compare your point cloud and label data.
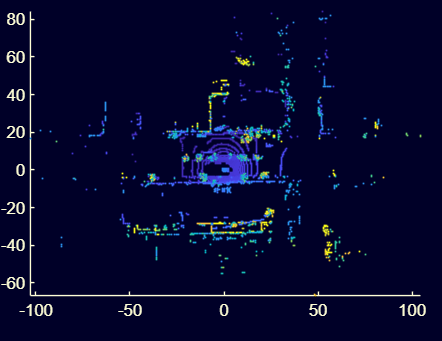
View the xy-axes of a point cloud. This is the top view of the scene, line of sight is along the z axis.
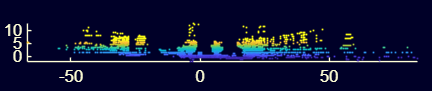
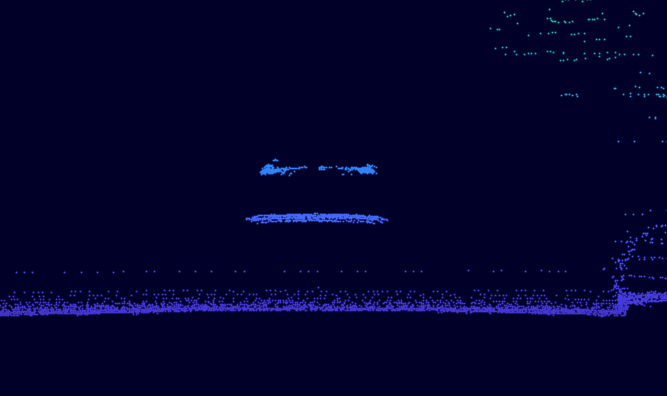
View the yz-axes of a point cloud. This is the front view of the scene, line of sight is along the x axis.
View the xz-axes of a point cloud. This is the side view of the scene, line of sight is along the y axis.

View from a high angle above a point cloud.
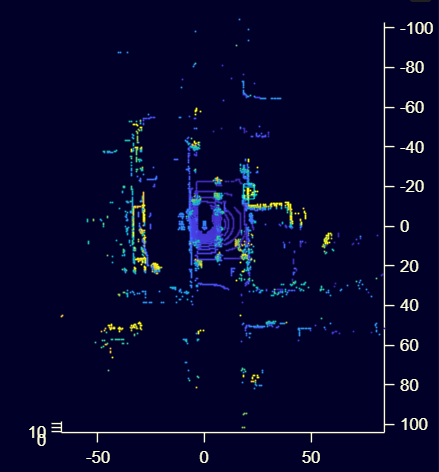
View the point cloud from a fixed distance behind the ego vehicle (actor) along the X and Y axes, which you can specify as one of these options:
+X-X+Y-Y
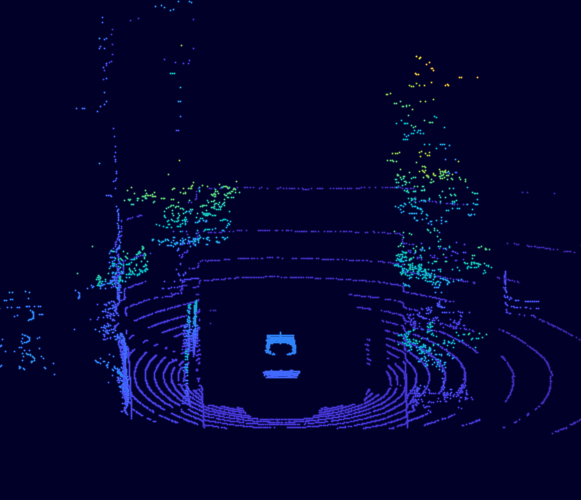
View a point cloud from the perspective of the ego vehicle, along the X and Y axes, which you can specify as one of these options:
+X-X+Y-Y
Point Size
To adjust the displayed point size of the point cloud, specify the value of the Point Size parameter on the Point Cloud tab of the app toolstrip.

Ground View
Set Ground View to specify whether the visualization displays all the points, only the ground points, or only the nonground points in the point cloud.
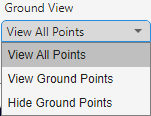
Select Ground Settings to change the ground segmentation algorithm and tune the corresponding parameters.
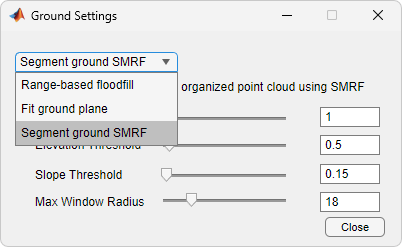
In the Ground Settings dialog box, select a segmentation algorithm from the list. The dialog box then displays the parameters for the selected algorithm, along with their values, and a slider for each with which to adjust that parameter value, to fine-tune your ground segmentation results. The app supports these algorithms:
Segment ground SMRF(default) — Segment the ground plane in either organized or unorganized point cloud data using thesegmentGroundSMRFfunction. Use this algorithm for non-uniform ground planes and aerial lidar data. The default parameters have been tuned for aerial data. For ground lidar data, decrease the Max Window Radius parameter to5and the Elevation Threshold parameter to a value in the range [0.2,0.3].Range-based floodfill— Segment the ground plane in organized point cloud data using thesegmentGroundFromLidarDatafunction.Fit ground plane— Segment the ground plane in organized point cloud data using thepcfitplanefunction.
After loading the signals and configuring the display, you can create label definitions and label the data, as described in Create Labels and Label Multi-Sensor Data.

