Configure Polyspace as You Code in Visual Studio Code
Configure the Polyspace as You Code extension before you begin your first analysis. Configuration of the extension allows for customization of your workstation and analysis preferences. Settings are preserved between sessions.
In this tutorial, you:
Manually configure the build.
Set automatic quality monitoring.
Set analysis on save.
Configure Polyspace checkers.
Analyze header files.
Set analysis script.
Open your files in Visual Studio Code. Click the Polyspace® icon ![]() displayed in the Visual Studio Code sidebar to open the Polyspace extension sidebar. The sidebar contains different panes that are
referenced in this guide, such as Quality Monitoring,
Configuration, and Baseline.
displayed in the Visual Studio Code sidebar to open the Polyspace extension sidebar. The sidebar contains different panes that are
referenced in this guide, such as Quality Monitoring,
Configuration, and Baseline.
Manually Configure Your Build
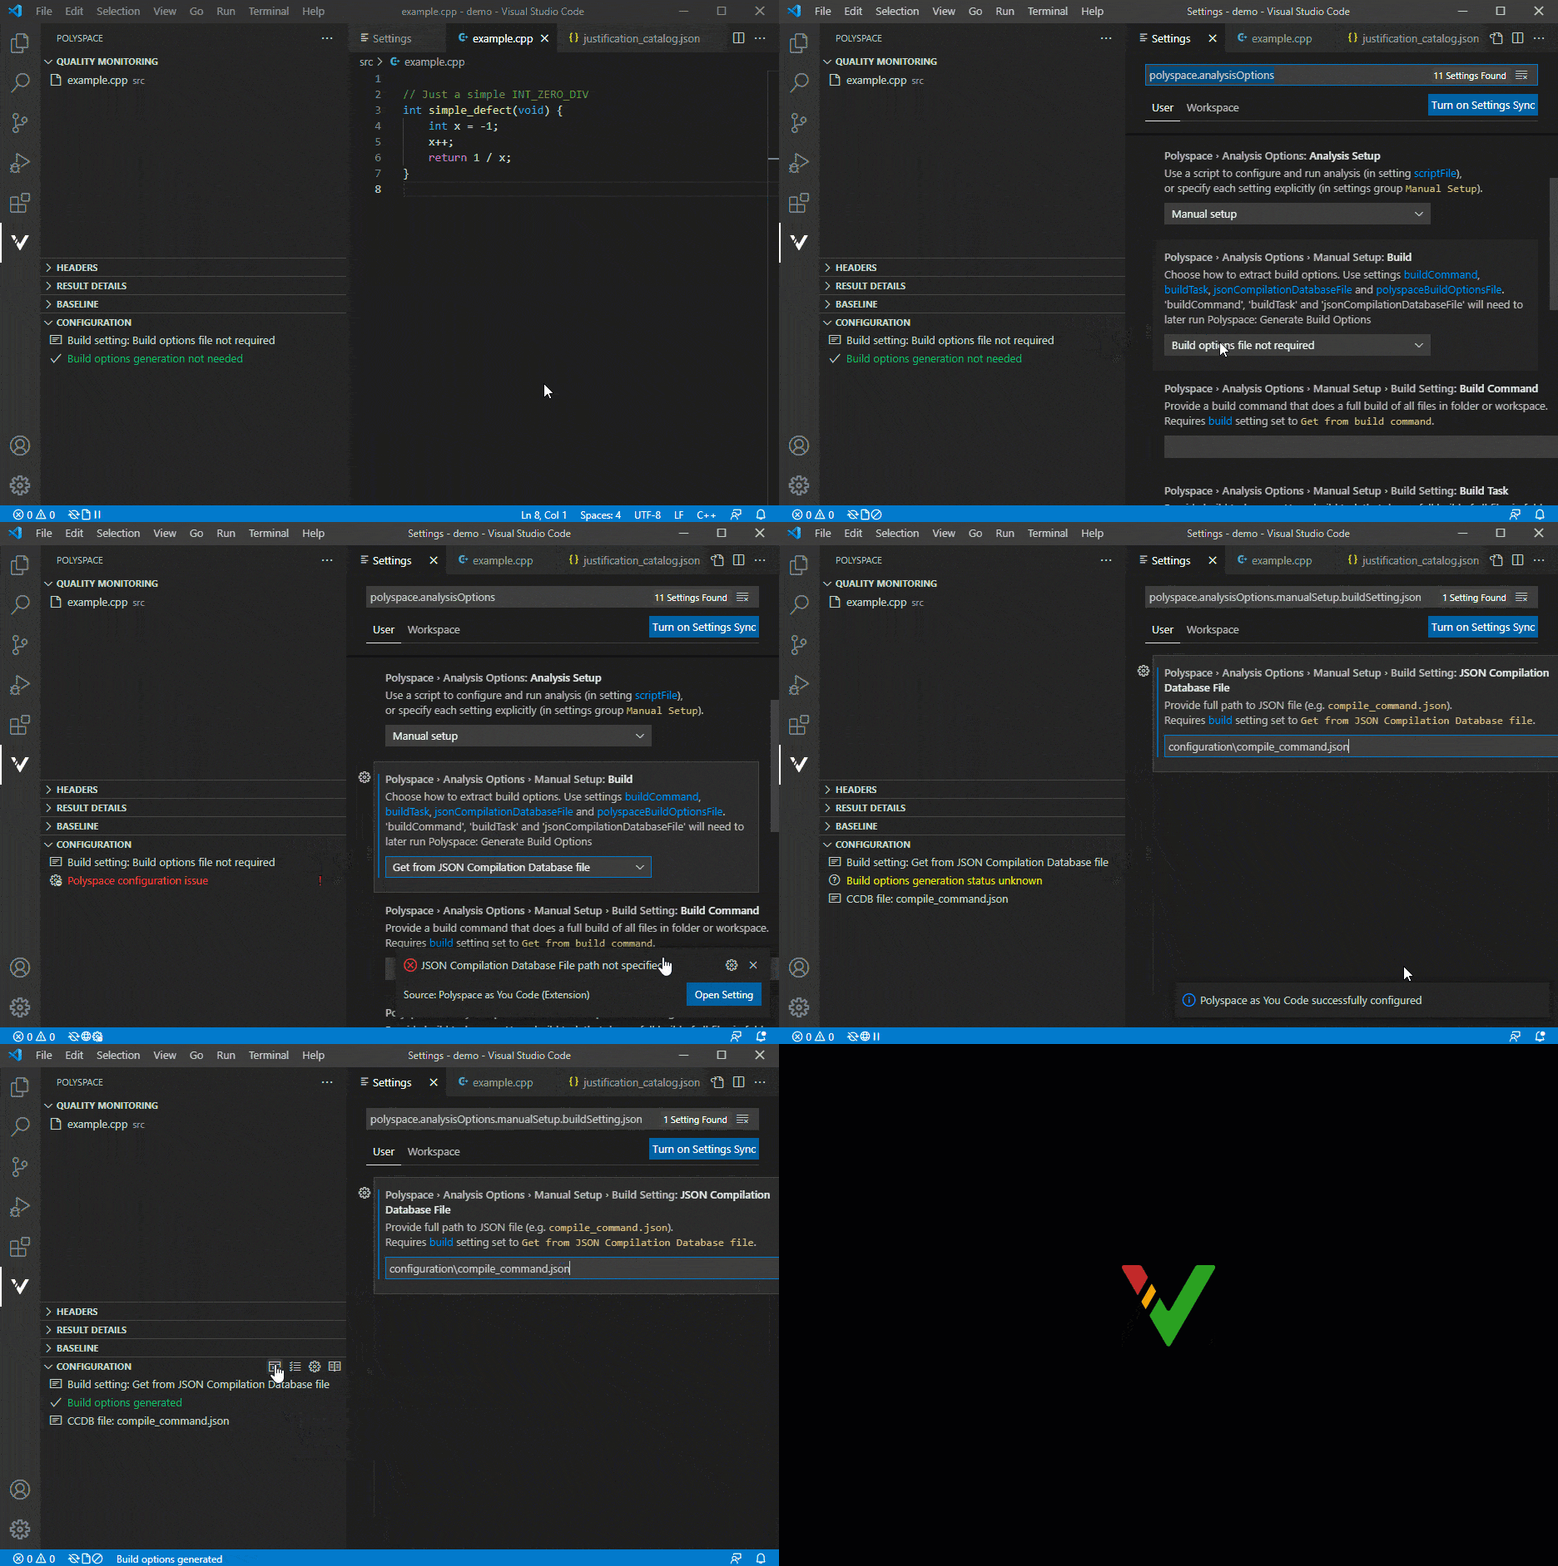
You have the option of manually configuring your build. Manual setup of the analysis involves specifying build options. You can extract build options from a Visual Studio Code build task or JSON Compilation Database file, or specify them in a build options file.
For this tutorial, you do not set the build options manually.
Click the settings icon ![]() in the Configuration pane of
the Polyspace sidebar or go to Settings.
Search for
in the Configuration pane of
the Polyspace sidebar or go to Settings.
Search for polyspace.analysisOptions to view the various build
options. The Manual Setup: Build setting allows you to choose
how to provide your options file. Use the Manual Setup: Build
option of the same file type to provide the path to your options file.
For more information on build options, see Configure Analysis Settings.
Set Automatic Quality Monitoring
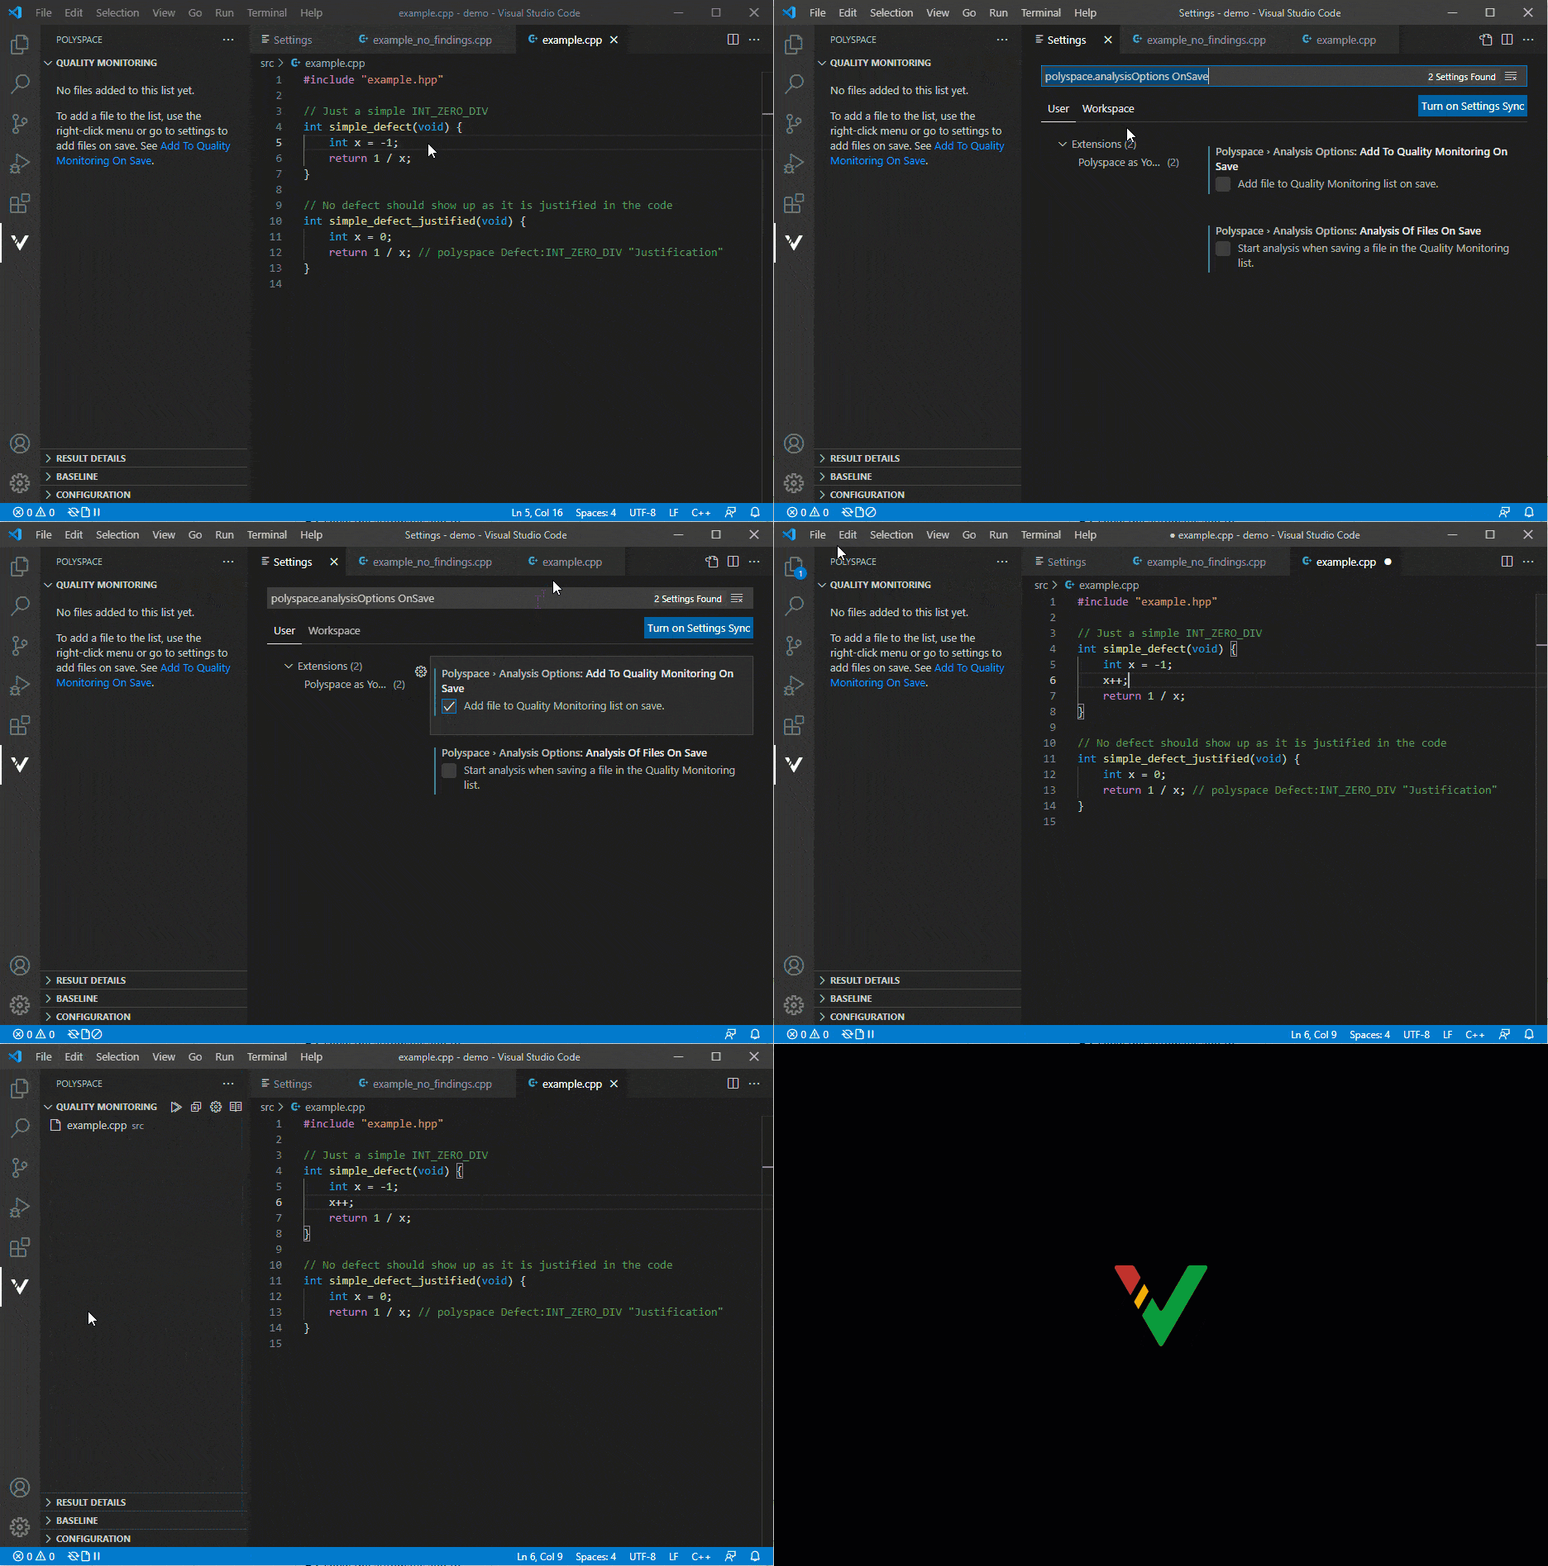
Polyspace has a Quality Monitoring list that keeps track of edited files. Polyspace can analyze all files listed in the Quality Monitoring list at the same time. You can choose to have Polyspace automatically add files to the Quality Monitoring list or manually add files.
If the setting
polyspace.analysisOptions.addToQualityMonitoringOnSave is
active, Polyspace adds files to the Quality Monitoring list
automatically when a file is saved. You can manually add files to the list by
right-clicking inside the file editor and selecting Add file to the
Polyspace Quality Monitoring list.
Turn on automatic quality monitoring. Click the settings icon in the
Quality Monitoring pane of the
Polyspace sidebar ![]() and select the check box for Add To
Quality Monitoring On Save. Alternatively, open the
Settings tab and search for the option
and select the check box for Add To
Quality Monitoring On Save. Alternatively, open the
Settings tab and search for the option
polyspace.analysisOptions.addToQualityMonitoringOnSave.
Select the check box to activate the setting.
Set Analysis on Save
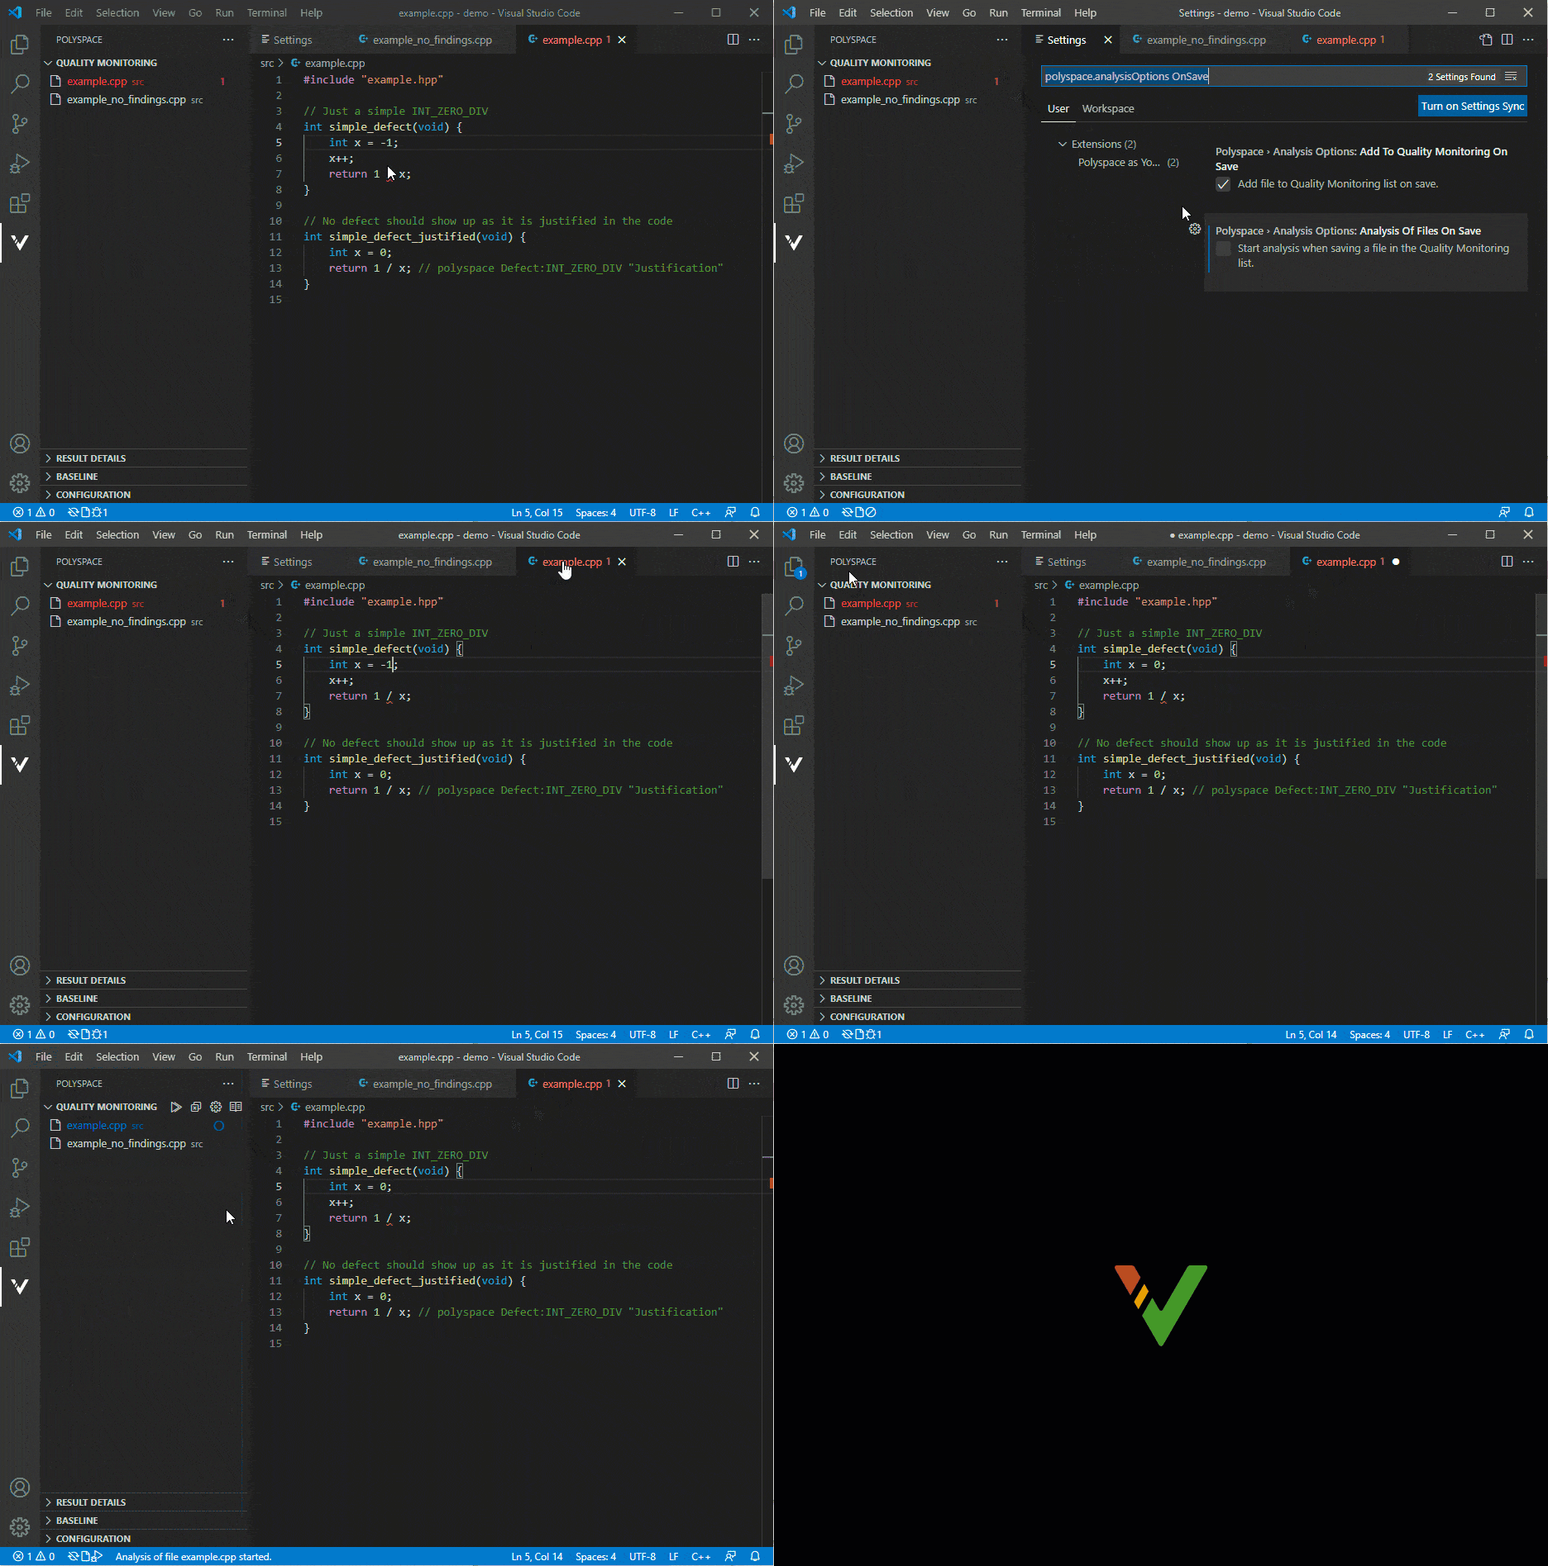
Similarly to quality monitoring, Polyspace can automatically run an analysis of any file in the Quality
Monitoring list when the file is saved. Alternatively, you can
manually run analysis of individual files or a group of files. Manually trigger an
analysis by clicking the Run Polyspace Analysis icon ![]() next to the file in the Quality
Monitoring list or right-click inside the file editor and select
Run Polyspace Analysis.
next to the file in the Quality
Monitoring list or right-click inside the file editor and select
Run Polyspace Analysis.
Turn on automatic analysis of files. Click the settings icon in the
Quality Monitoring pane of the
Polyspace sidebar ![]() and select the check box for Analysis
Of Files On Save. Alternatively, open the
Settings tab and search for the option
and select the check box for Analysis
Of Files On Save. Alternatively, open the
Settings tab and search for the option
polyspace.analysisOptions.analysisOfFilesOnSave. Select the
check box to activate the setting.
Configure Polyspace Checkers
Polyspace checks for a default set of defects and standards. You can customize
this set of standards and defects based on which certification standards you want to
check for. Use the settings option
polyspace.analysisOptions.manualSetup:checkersfile to set the
checkers XML file for your project.
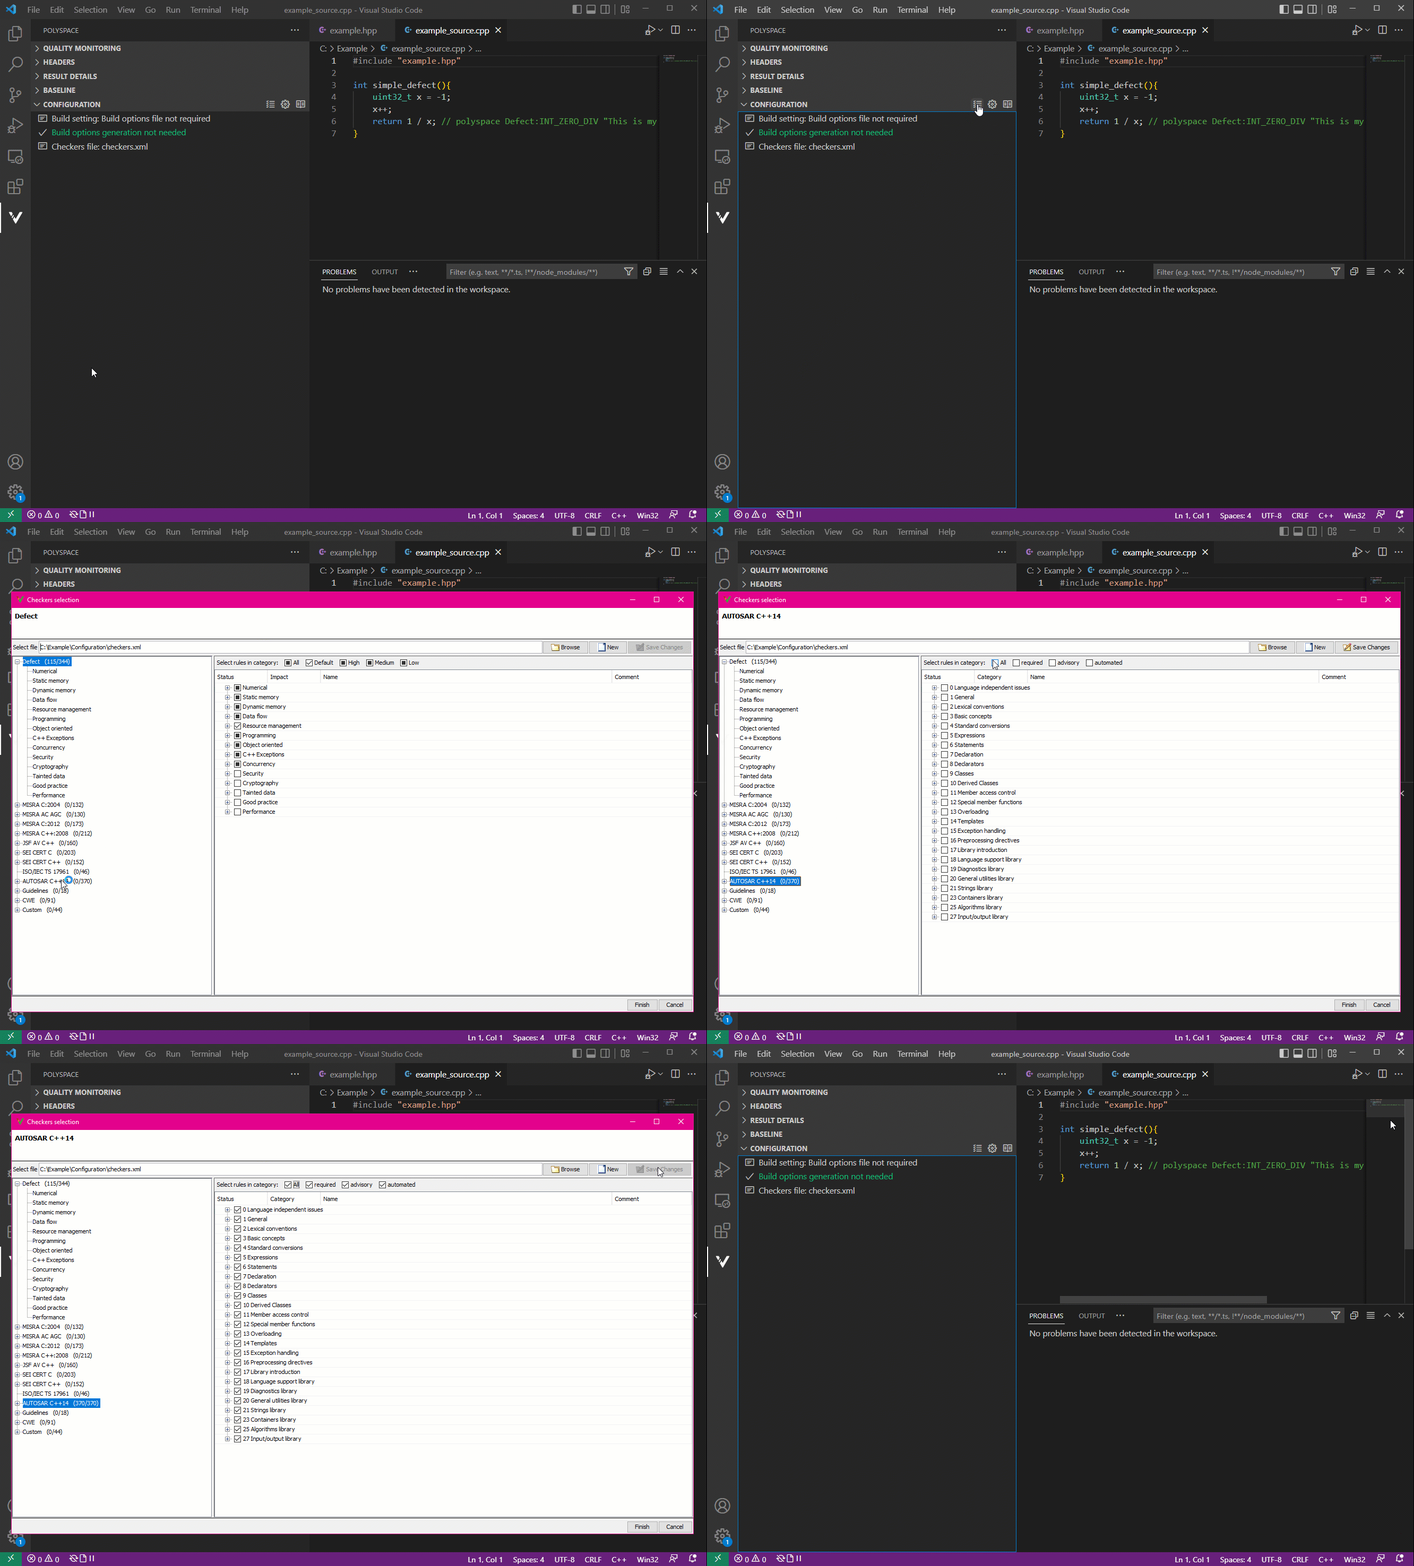
Turn on the AUTOSAR C++14 checkers. In the Configuration
section of the Polyspace sidebar, click the Configure
Checkers icon ![]() to open the Checkers
Selection window.
to open the Checkers
Selection window.
You can create, save, and open saved checkers selection files. For more information, see Configure Checkers for Polyspace as You Code in Visual Studio Code.
Click on AUTOSAR C++14 on the left pane of the Checkers Selection window. In the right pane, select the All check box to enable all of the AUTOSAR C++14 rules. Click Save Changes in the top right corner to save your checker selection and close the window to return to the Visual Studio Code application.
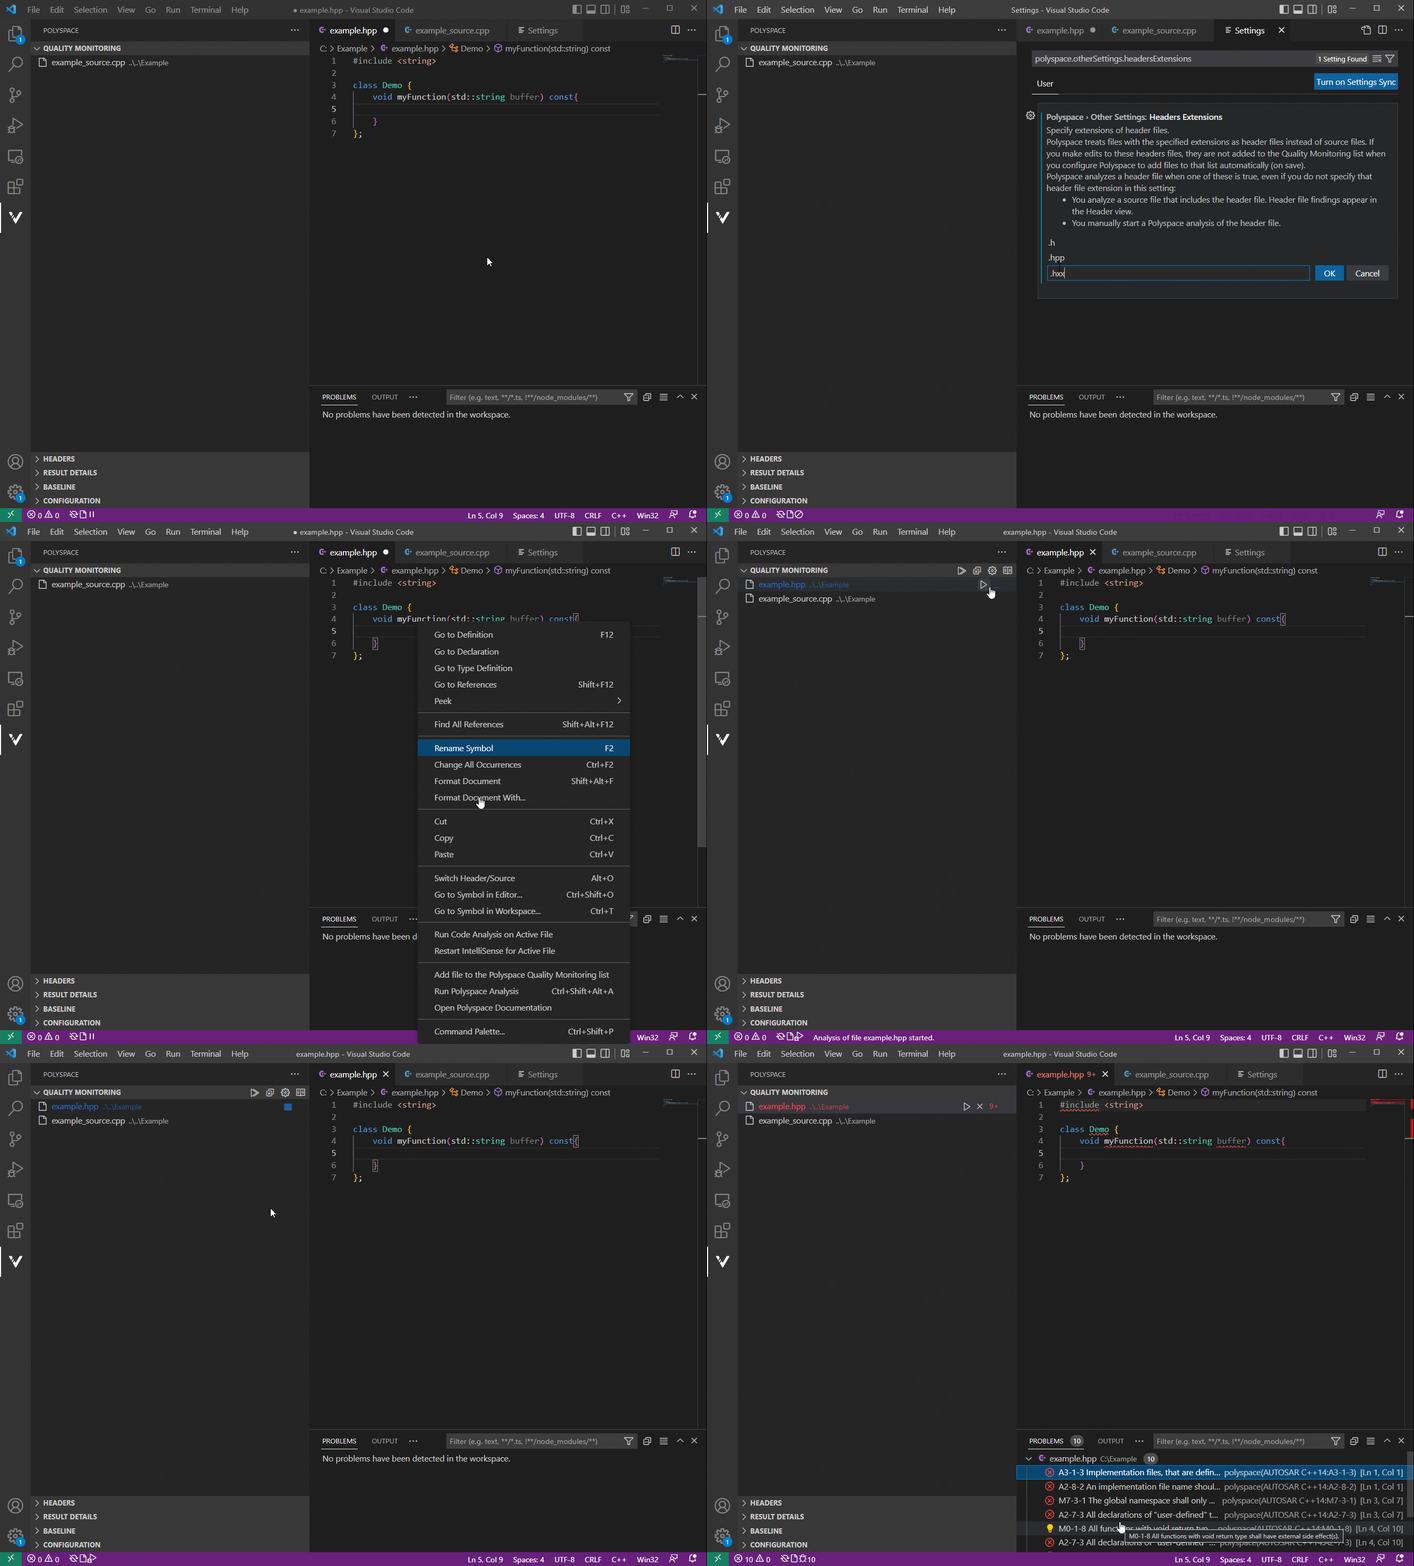
Analyze Header Files
You can run an analysis on header files as if they were source files.
First, define the extensions of your header files. Click the settings icon in the
Headers pane of the Polyspace sidebar ![]() . Alternatively, open the
Settings tab and search for the option
. Alternatively, open the
Settings tab and search for the option
polyspace.otherSettings.headersExtensions.
Click Add Item and add the file extension
.hpp if it is not already there. Click
OK to save the file extension in the list.
Manually add the example.hpp header file to the
Quality Monitoring list and initiate an analysis by
clicking the Run Polyspace Analysis button ![]() .
.
Set Analysis Script
You can provide a script to configure and run your Polyspace analysis in Polyspace as You Code.
For this tutorial, you do not set a script.
If you have a script, open the Settings tab and search for
the option polyspace.analysisOptions.script.
Provide the path to the script in the Script File setting text box. Turn on Script for the Analysis Setup setting using the list.
Once you have configured the Polyspace as You Code extension, you are ready to run an analysis and review your results.

