passivity
Plot passivity of N-by-N rational fit output
Description
passivity( plots the passivity of
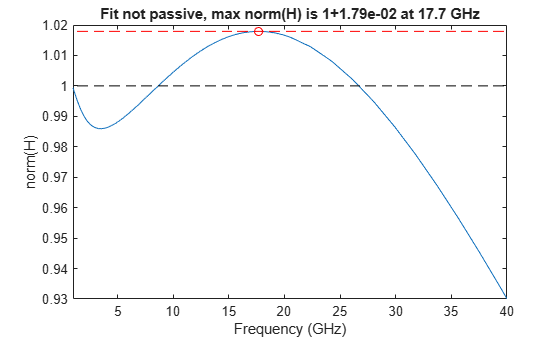
the input, fit)fit, over a range of frequencies. Passivity is
evaluated by calculating the two-norm of the fitted response across frequencies. A
model is considered passive if the maximum two-norm value observed over all
frequencies is less than or equal to one.
Examples
Read the file, passive.s2p and fit the 2-by-2 S-parameters.
S = sparameters('passive.s2p');
fit = rationalfit(S);
Test the passivity of the 2-by-2 fit.
ispassive(fit)
ans = logical
   0
Plot the passivity of the 2-by-2 fit.
figure
passivity(fit,[1e9 40e9])
Input Arguments
Output Arguments
Version History
Introduced in R2019a