Main Content

plot

Plot climate scenario data

Since R2025a

    Description

    plot(cs,Name=Value) plots the climate scenario data contained in the climateScenario object, cs. Select the data for your plot by specifying name-value arguments for the identifiers. For example, plot(cs,Region="Canada",Variable="Carbon price") plots the price of carbon in Canada.

    example

    h = plot(cs,Name=Value) returns a Line object or an array of Line objects. Use the figure handle h to modify properties of the plot after creating it.

    Examples

    collapse all

    Plot climate scenario data contained in a climateScenario object. The climate transition scenario data that this example uses is available from the Bank of Canada and is free of charge at http://www.bankofcanada.ca.

    Load the data.

    load("BankOfCanadaClimateScenarioData.mat")
    data = ClimateTransitionScenarioData;
    head(data)
        k    CL_GEOGRAPHY    CL_SECTOR              CL_VARIABLE                    CL_UNIT                CL_SCENARIO           CL_YEAR    CL_VALUE
        _    ____________    _________    _______________________________    ___________________    ________________________    _______    ________
    
        1       Canada       National     Carbon price                       US$2014/tCO2e          Baseline (2019 policies)     2020       12.106 
        2       Canada       National     Carbon price                       US$2014/tCO2e          Below 2°C immediate          2020       12.106 
        3       Canada       National     Emissions | total GHG (scope 1)    Million tonnes CO2e    Baseline (2019 policies)     2020       781.04 
        4       Canada       National     Emissions | total GHG (scope 1)    Million tonnes CO2e    Below 2°C immediate          2020       781.04 
        5       Canada       National     Input price | Coal                 Index (2014 = 1)       Baseline (2019 policies)     2020       1.2875 
        6       Canada       National     Input price | Coal                 Index (2014 = 1)       Below 2°C immediate          2020       1.2875 
        7       Canada       National     Input price | Crops                Index (2014 = 1)       Baseline (2019 policies)     2020       1.0031 
        8       Canada       National     Input price | Crops                Index (2014 = 1)       Below 2°C immediate          2020       1.0031 
    

    Create a climateScenario object.

    cs = climateScenario(data, ...
                    RegionVar="CL_GEOGRAPHY", ...
                    VariableVar="CL_VARIABLE", ...
                    ScenarioVar="CL_SCENARIO", ...
                    YearVar="CL_YEAR", ...
                    ValueVar="CL_VALUE", ...
                    CustomIdentifiers="Sector", ...
                    CustomIdentifierVars="CL_SECTOR", ...
                    UnitVar="CL_UNIT");

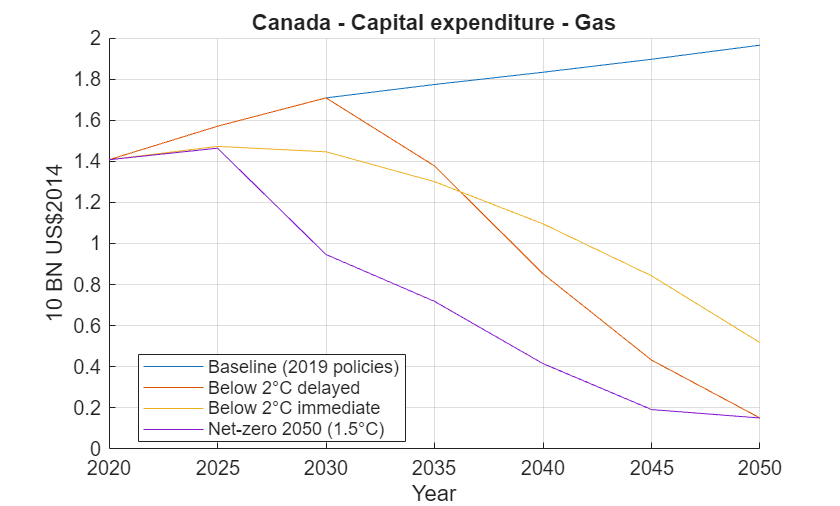
    Use plot by specifying the Region and Variable name-value arguments to plot capital expenditure in Canada. Use the custom identifier Sector to limit the plot to the gas sector.

    h = plot(cs,Region="Canada",Variable="Capital expenditure",Sector="Gas");

    Figure contains an axes object. The axes object with title Canada - Capital expenditure - Gas, xlabel Year, ylabel 10 BN US$2014 contains 4 objects of type line. These objects represent Baseline (2019 policies), Below 2°C delayed, Below 2°C immediate, Net-zero 2050 (1.5°C).

    Input Arguments

    collapse all

    Climate scenario object, specified as a climateScenario object.

    Name-Value Arguments

    collapse all

    Specify optional pairs of arguments as Name1=Value1,...,NameN=ValueN, where Name is the argument name and Value is the corresponding value. Name-value arguments must appear after other arguments, but the order of the pairs does not matter.

    Example: h = plot(cs,Region="Canada",Variable="Capital expenditure",Sector="Coal") plots capital expenditure for Canada in the coal sector.

    Region identifier values, specified as a string vector. By default, all the regions are plotted if you do not specify a string vector for Region.

    Variable identifier values, specified as a string vector. By default, all the variables are plotted if you do not specify a string vector for Variable.

    Scenario identifier values, specified as a string vector. By default, all the scenarios are plotted if you do not specify a string vector for Scenario.

    Year identifier values, specified as a numeric vector. By default, all the years are plotted if you do not specify a numeric vector for Year.

    Names of custom identifiers, specified as a string vector containing values of cs.CustomerIndentifiers. CustomIdentifers must match an identifier property contained in cs.CustomIdentifiers. For example, if "Sector" is a custom identifier for the property cs.CustomIdentifier, then h = plot(cs,Region="Canada",Variable="Capital expenditure",Sector="Coal") plots capital expenditure for Canada in the coal sector.

    Axes object in which to plot. If you do not specify Parent, the plot function plots on the current Cartesian axes.

    Version History

    Introduced in R2025a