risk.validation.cumulativeAccuracyProfile
R2026bSyntax
Description
risk.validation.cumulativeAccuracyProfile(
plots the cumulative accuracy profile (CAP) for the classification results determined by the
Score,BinaryResponse)Score and BinaryResponse arguments. The plot
also includes a dotted line and a solid line indicating the CAP of a random model and a
perfect model, respectively, and shows the accuracy ratio (AR) in the lower right
corner.
risk.validation.cumulativeAccuracyProfile(___,
specifies additional options using one or more name-value arguments. For example, you can
specify the direction in which to sort the score variable and whether to plot the CAP of a
perfect model.Name=Value)
h = risk.validation.cumulativeAccuracyProfile(___)
Examples
Load credit validation data.
load CreditValidationData.matThe CreditScore and Default variables in the ScorecardValidationData table, respectively, contain data for the credit score and whether the customer defaulted. Plot the cumulative accuracy profile (CAP) of the data and use the ModelID name-value argument to give a name to the model in the legend of the plot. Specify the SortDirection name-value argument as "ascending" because low credit scores correspond to a higher probability of default.
CreditScore = ScorecardValidationData.CreditScore;
Default = ScorecardValidationData.Default;
risk.validation.cumulativeAccuracyProfile(CreditScore,Default,ModelID="Scorecard",SortDirection="ascending")
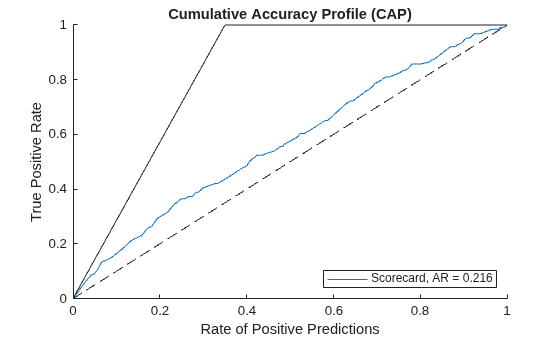
The plot shows the CAP for the data in a solid blue line, the CAP of a perfect model in a solid black line, and the CAP of a random model in a dotted line. The plot also shows the name of the model and the accuracy ratio (AR) in the lower right corner.
Load credit validation data.
load CreditValidationData.matThe ScorecardPD and DecisionTreePD variables in the PDModelsValidationData table contain data for the customer probability of default (PD) based, respectively, on a scorecard and a decision tree model. The Default variable contains data for whether the customer defaulted. Plot the cumulative accuracy profiles (CAPs) for both models by specifying the Score argument as a matrix with two columns.
ScorecardPD = PDModelsValidationData.ScorecardPD;
DecisionTreePD = PDModelsValidationData.DecisionTreePD;
Default = PDModelsValidationData.Default;
risk.validation.cumulativeAccuracyProfile([ScorecardPD DecisionTreePD],Default,ModelID=["Scorecard" "Decision tree"])
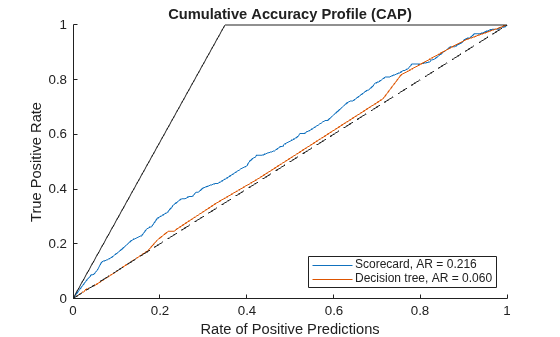
The plot shows the CAPs for the two models.
Input Arguments
Name-Value Arguments
Output Arguments
Version History
Introduced in R2026b

