risk.validation.plotSpearmanRanks
R2026bSyntax
Description
risk.validation.plotSpearmanRanks(
plots the ranks of the observations in Sample1,Sample2)Sample1 against the ranks of the
observations in Sample2. The plot also displays the Spearman rank
correlation coefficient in the lower right corner.
risk.validation.plotSpearmanRanks(
plots into the axes specified by ax,Sample1,Sample2)ax instead of into the current axes
(gca).
risk.validation.plotSpearmanRanks(
plots into the axes specified by Sample1,Sample2,Parent=ax)ax instead of into the current axes
(gca).
Note
The
risk.validation.plotSpearmanRanks
function ignores the ax argument when you specify the
Parent name-value argument.
h = risk.validation.plotSpearmanRanks(___)
Examples
Load the CreditValidationData data.
load CreditValidationData.matThe table LGDModelsValidationData contains the variables RegressionLGD, TobitLGD, and ObservedLGD. RegressionLGD and TobitLGD contain data for predicted loss given default (LGD), and ObservedLGD contains data for observed LGD.
Plot the ranks of the regression model's LGD predictions against the Tobit model's predictions. Then plot the ranks of the observed LGDs against each model's predictions.
Regression = LGDModelsValidationData.RegressionLGD;
Tobit = LGDModelsValidationData.TobitLGD;
Observed = LGDModelsValidationData.ObservedLGD;
tiledlayout("vertical")
nexttile
risk.validation.plotSpearmanRanks(Regression,Tobit)
nexttile
risk.validation.plotSpearmanRanks(Regression,Observed)
nexttile
risk.validation.plotSpearmanRanks(Tobit,Observed)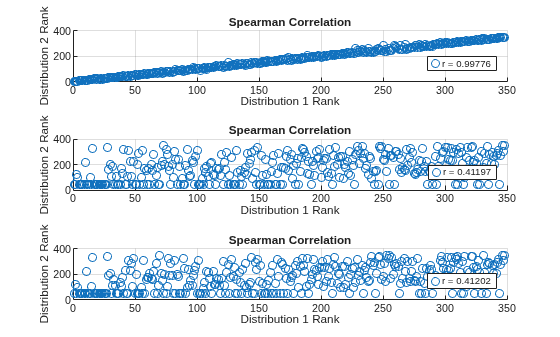
The plots show that the regression model predictions are highly correlated with the Tobit model predictions. This observation is consistent with their Spearman correlation of 0.998. However, each model's predictions are only moderately correlated with the observed predictions.
Input Arguments
Output Arguments
References
[1] Basel Committee on Banking Supervision, "Calculation of RWA for market risk." January, 2022. https://www.bis.org/basel_framework/chapter/MAR/32.htm?inforce=20220101&published=20191215.
Version History
Introduced in R2026a

