scatter3
Display point cloud in scatter plot
Description
scatter3( plots
the input pcloud)pcloud point cloud as a 3-D scatter
plot in the current axes handle. If the data contains RGB information
for each point, the scatter plot is colored accordingly.
scatter3( provides additional
options specified by one or more pcloud,Name,Value)Name,Value pair arguments. Name
must appear inside single quotes (''). You can specify several
name-value pair arguments in any order as
Name1,Value1,...,NameN,ValueN).
h = scatter3(___)h to modify properties of the scatter
series after it is created.
When plotting ROS point cloud messages, MATLAB® follows the standard ROS convention for axis orientation. This convention states that positive x is forward, positive y is left, and positive z is up. If cameras are used, a second frame is defined with an “_optical” suffix that changes the orientation of the axis. In this case, positive z is forward, positive x is right, and positive y is down. MATLAB looks for the “_optical” suffix and will adjust the axis orientation of the scatter plot accordingly. For more information, see Axis Orientation on the ROS Wiki.
Examples
Connect to a ROS network. Subscribe to a point cloud message topic.
rosinit('192.168.17.129')Initializing global node /matlab_global_node_65972 with NodeURI http://192.168.17.1:51971/
sub = rossubscriber('/camera/depth/points');
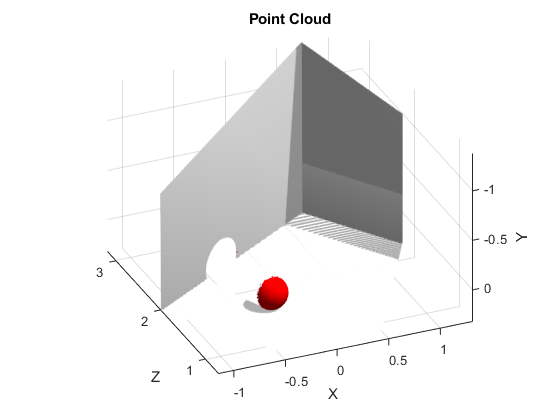
pause(1)Get the latest point cloud message. Plot the point cloud.
pcloud = sub.LatestMessage;
scatter3(pcloud)
Plot all points as black dots.
scatter3(sub.LatestMessage,'MarkerEdgeColor',[0 0 0]);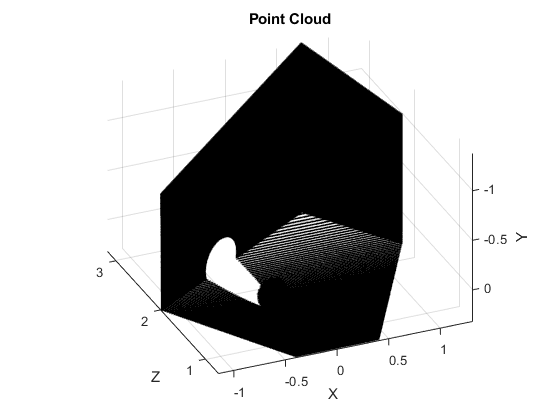
Input Arguments
Name-Value Arguments
Specify optional pairs of arguments as
Name1=Value1,...,NameN=ValueN, where Name is
the argument name and Value is the corresponding value.
Name-value arguments must appear after other arguments, but the order of the
pairs does not matter.
Before R2021a, use commas to separate each name and value, and enclose
Name in quotes.
Example: 'MarkerEdgeColor',[1 0 0]
Alternatively, you can specify some common colors by name. This table lists the named color options, the equivalent RGB triplets, and the hexadecimal color codes.
| Color Name | Short Name | RGB Triplet | Hexadecimal Color Code | Appearance |
|---|---|---|---|---|
"red" | "r" | [1 0 0] | "#FF0000" |
|
"green" | "g" | [0 1 0] | "#00FF00" |
|
"blue" | "b" | [0 0 1] | "#0000FF" |
|
"cyan"
| "c" | [0 1 1] | "#00FFFF" |
|
"magenta" | "m" | [1 0 1] | "#FF00FF" |
|
"yellow" | "y" | [1 1 0] | "#FFFF00" |
|
"black" | "k" | [0 0 0] | "#000000" |
|
"white" | "w" | [1 1 1] | "#FFFFFF" |
|
"none" | Not applicable | Not applicable | Not applicable | No color |
This table lists the default color palettes for plots in the light and dark themes.
| Palette | Palette Colors |
|---|---|
Before R2025a: Most plots use these colors by default. |
|
|
|
You can get the RGB triplets and hexadecimal color codes for these palettes using the orderedcolors and rgb2hex functions. For example, get the RGB triplets for the "gem" palette and convert them to hexadecimal color codes.
RGB = orderedcolors("gem");
H = rgb2hex(RGB);
Before R2023b: Get the RGB triplets using RGB =
get(groot,"FactoryAxesColorOrder").
Before R2024a: Get the hexadecimal color codes using H =
compose("#%02X%02X%02X",round(RGB*255)).
Example: [0.5 0.5 0.5]
Example: "blue"
Example: "#D2F9A7"
Parent of axes, specified as the comma-separated pair consisting of
'Parent' and an axes object in which to draw the
point cloud. By default, the point cloud is plotted in the active
axes.
Outputs
Version History
Introduced in R2019b