transform
Transform signal datastore
Syntax
Description
transformDatastore = transform(sds,@fcn)read
function.
transformDatastore = transform(sds,@fcn,'IncludeInfo',infoIn)sds.
Examples
The sample_chirps folder contains sample files included with Signal Processing Toolbox™. Each file contains a chirp and a random sample rate, fs, ranging from 100 to 150 Hz. Create a signal datastore that points to four of the files in sample_chirps and specify the name of the sample rate variable.
addpath("sample_chirps")
files = ["chirp_1.mat","chirp_4.mat","chirp_9.mat","chirp_10.mat"];
sds = signalDatastore(files,SampleRateVariableName="fs");
Define a function that takes the output of the read function and computes and returns:
The spectrograms of the chirps.
The vector of time instants corresponding to the centers of the windowed segments.
The frequencies corresponding to the estimates.
function [dataOut,infoOut] = extractSpectrogram(dataIn,info)
    [dataOut,F,T] = pspectrum(dataIn,info.SampleRate,"spectrogram",...
                              TimeResolution=0.25,...
                              OverlapPercent=40,Leakage=0.8);
    infoOut = info;
    infoOut.CenterFrequencies = F;
    infoOut.TimeInstants = T;
end
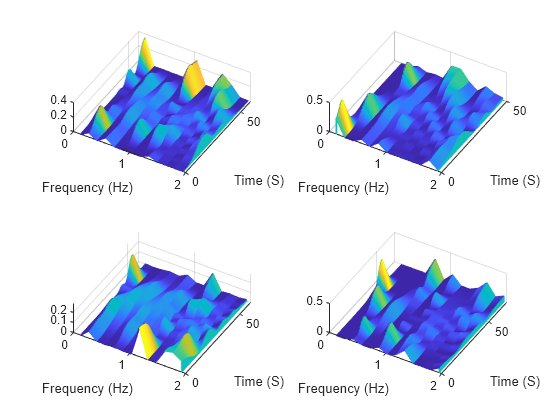
Call the transform function to create a datastore that computes the spectrogram of each chirp using the function you defined.
sdsNew = transform(sds,@extractSpectrogram,IncludeInfo=true);
While the transformed datastore has unread files, read from the new datastore and visualize the spectrograms in three-dimensional space.
t = tiledlayout("flow");
while hasdata(sdsNew)
    nexttile
    [sig,infoOut] = read(sdsNew);
    waterfall(infoOut.TimeInstants,infoOut.CenterFrequencies,sig)
    xlabel("Frequency (Hz)")
    ylabel("Time (S)")
    view([30 70])
end
Specify the path to four signals included with MATLAB®. The signals are recordings of a bird chirp, a gong, a train, and a splat. All signals are sampled at 8192 Hz.
folder = fullfile(matlabroot,'toolbox','matlab','audiovideo', ...
         ["chirp.mat","gong.mat","train.mat","splat.mat"]);
Create a signal datastore that points to the specified files. Each file contains the variable Fs that denotes the sample rate.
sds1 = signalDatastore(folder,'SampleRateVariableName','Fs');
Define a function that takes the output of the read function and calculates the upper and lower envelopes of the signals using spline interpolation over local maxima separated by at least 80 samples. The function also returns the sample times for each signal.
function [dataOut,infoOut] = signalEnvelope(dataIn,info)
    [dataOut(:,1),dataOut(:,2)] = envelope(dataIn,80,'peak');
    infoOut = info;
    infoOut.TimeInstants = (0:length(dataOut)-1)/info.SampleRate;
end
Call the transform function to create a second datastore, sds2, that computes the envelopes of the signals using the function you defined.
sds2 = transform(sds1,@signalEnvelope,"IncludeInfo",true);Combine sds1 and sds2 create a third datastore. Each call to the read function from the combined datastore returns a matrix with three columns:
The first column corresponds to the original signal.
The second and third columns correspond to the upper and lower envelopes, respectively.
sdsCombined = combine(sds1,sds2);
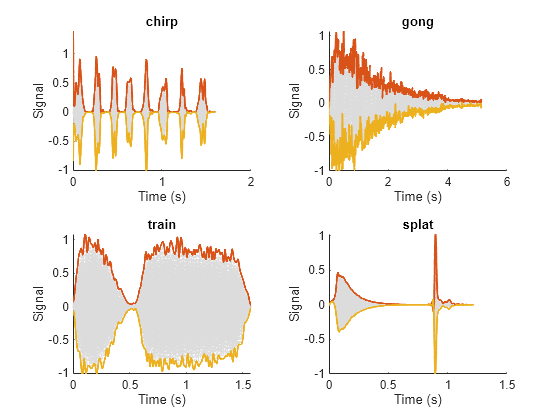
Read and display the original data and the upper and lower envelopes from the combined datastore. Use the extractBetween function to extract the file name from the file path.
tiledlayout('flow')
while hasdata(sdsCombined)
    [dataOut,infoOut] = read(sdsCombined);
    ts = infoOut{2}.TimeInstants;
    nexttile
    hold on
    plot(ts,dataOut(:,1),'Color','#DCDCDC','LineStyle',':')
    plot(ts,dataOut(:,2:3),'Linewidth',1.5)
    hold off
    xlabel('Time (s)')
    ylabel('Signal')
    title(extractBetween(infoOut{:,2}.FileName,'audiovideo\','.mat'))
end
Input Arguments
Output Arguments
Version History
Introduced in R2020a
See Also
signalDatastore | subset | hasdata | progress