plot
Plot all series associated with Node object
Description
fh = plot(node,Name,Value)Name,Value
pair arguments. For example, specify 'units' followed by a unit name to
plot only nodes that are commensurate with the specified unit.
Examples
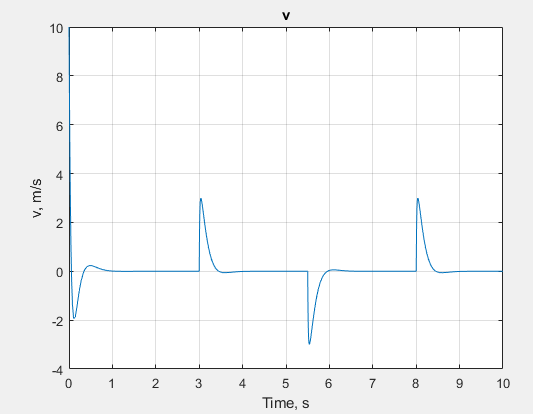
Plot velocity of port R of a Translational Spring block.
Open the Mass-Spring-Damper with Controller example model:
openExample('simscape/MassSpringDamperWithControllerExample')This example model has data logging enabled for the whole model, with the
Workspace variable name parameter set to
simlog_MassSpringDamperWithController.
Simulate the model to log the simulation data:
sim('MassSpringDamperWithController');Plot velocity of port R of the Translational
Spring block Spring.
plot(simlog_MassSpringDamperWithController.Spring.R);
This command plots all the variables associated with a
Translational Spring block, but not with its ports. The
command assumes that he model has the default workspace variable name,
simlog, and that the Translational
Spring block is located at the top level of the model diagram.
plot(simlog.Translational_Spring, 'depth', 1)

Input Arguments
Name-Value Arguments
Output Arguments
Version History
Introduced in R2010b