Viewing Signals in Model Reference Instances
This example shows how to:
Configure your model to log signals in referenced models.
Use the Simulation Data Inspector to view and analyze logged signals in referenced models.
Open Top Model in Model Hierarchy
The top model, named MultiInstanceModelExample, contains three Model blocks that each reference a model named LimitedCounter.
To open the top model, open the project named MultiInstance.

Configure Signals to Log in Referenced Models
To view signals using the Simulation Data Inspector, edit the referenced model and mark the signals for logging.
In the referenced model, four signals are already marked for logging. To mark the signal named raw output for logging, select the signal. Then, pause on the ellipsis. From the action bar, select Log Selected Signal.

Alternatively, select multiple signals. Then, on the Simulation tab, select Log Signals.
Once you select the signals to log in the referenced model, select which signals to log from the top model in the hierarchy. On the Modeling tab, click Model Settings.
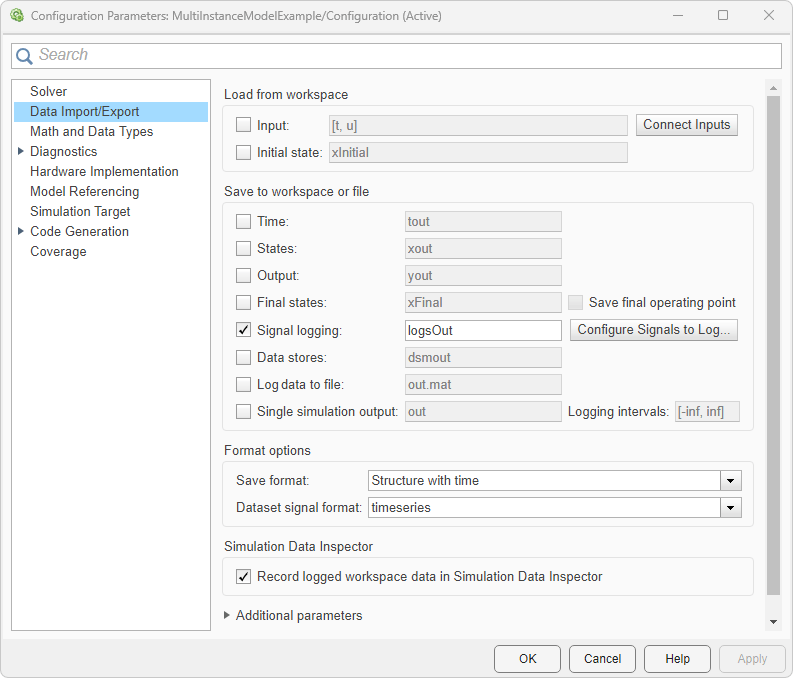
On the Data Import/Export pane, click Configure Signals to Log. The Simulink Signal Logging Selector dialog box opens.
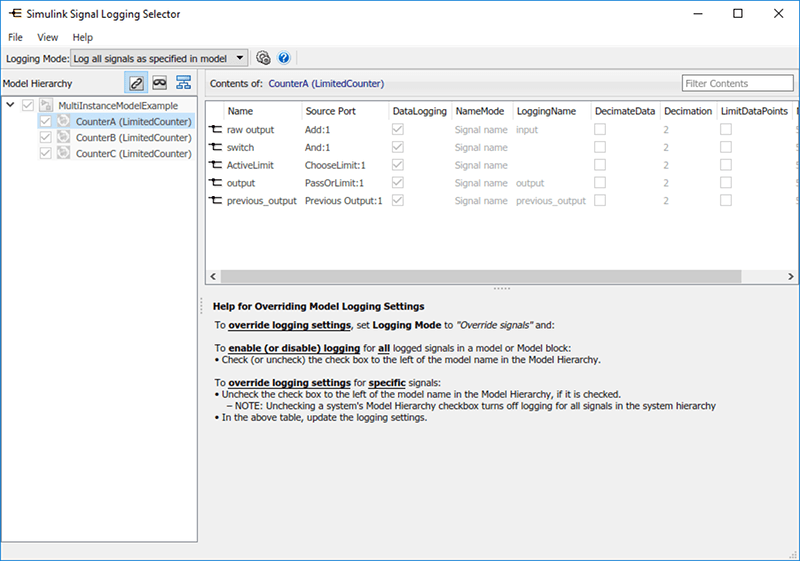
Two logging modes can be used when logging signals in referenced models.
To honor logging settings in the referenced models, set Logging Mode to
Log all signals as specified in model.To override logging settings in the referenced models, set Logging Mode to
Override signals. For example, this option lets you disable logging for signals in the referenced model or configure properties of logged signals, such as decimation and name.
View and Analyze Logged Signals Using the Simulation Data Inspector
When you have configured logging for a model hierarchy and saved the changes to the models, simulate the model. The simulation creates a Dataset object in the base workspace. Analyze and view the logged data in this object using standard MATLAB® tools or the Simulink® Simulation Data Inspector.
With the Simulation Data Inspector, you can:
View signal traces for any logged signals
Visually compare signal values for any logged signals
Compare signal values collected over multiple simulations
For example, use the Simulation Data Inspector to view the signal named output for two of the instances of the referenced model. The Simulation Data Inspector shows that the output of the Model block named CounterA increases more rapidly than the output of the Model block named CounterB. This behavior is expected because the Pulse Generator block that drives the Model block named CounterA runs at a faster rate than the Pulse Generator block that drives the Model named CounterB.
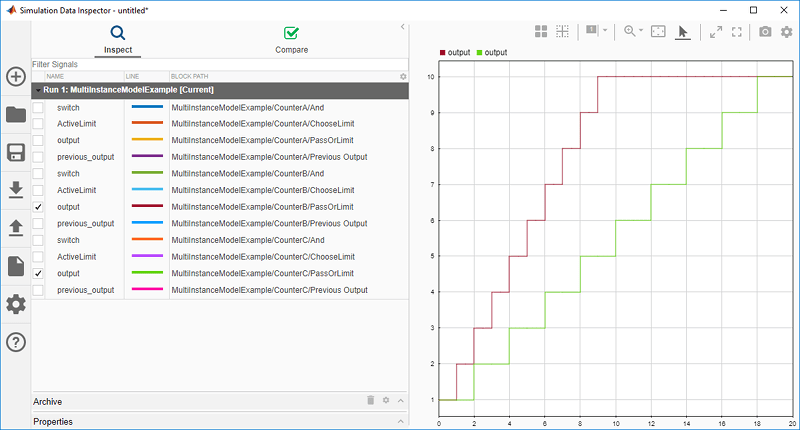
To configure what to display in the inspect table, click the gear icon at the top right of the table.

Compare Simulation Results Using the Simulation Data Inspector
The Simulation Data Inspector also allows you to compare multiple simulation runs. This functionality can help you understand how changes to your model affect results. For example, in the top model, double-click the block named upper. Then, set Value to 8 and simulate the model.
Compare the simulation results for the output of the Model block named CounterA. The upper limit of this signal has changed from 10 to 8, as expected. Because the tolerances are set to zero, the red octagon next to each signal indicates that the values have changed between runs.
