Define a Simulink Function in a Model
You can define and implement a Simulink® function in several ways.
Simulink Function block — Define function using Simulink blocks.
Chart (Stateflow) — Define graphical function, MATLAB® function, or Simulink function within a Stateflow® chart, and export to a Simulink model. For more information, see Export Stateflow Functions for Reuse (Stateflow).
S-Function block — Define function using an S-Function block. See
ssDeclareSimulinkFunction.
The following sections show how to define a Simulink function for the function y = timestwo(x). The function
multiplies a value (x) from a caller by 2, and then
sends the calculated value (y) back to the caller. To call the function,
see Call a Simulink Function from a Model.
Define and Call Simulink Functions
The model named ex_simulink_functions_and_function_callers shows multiple ways to define and call Simulink® functions.
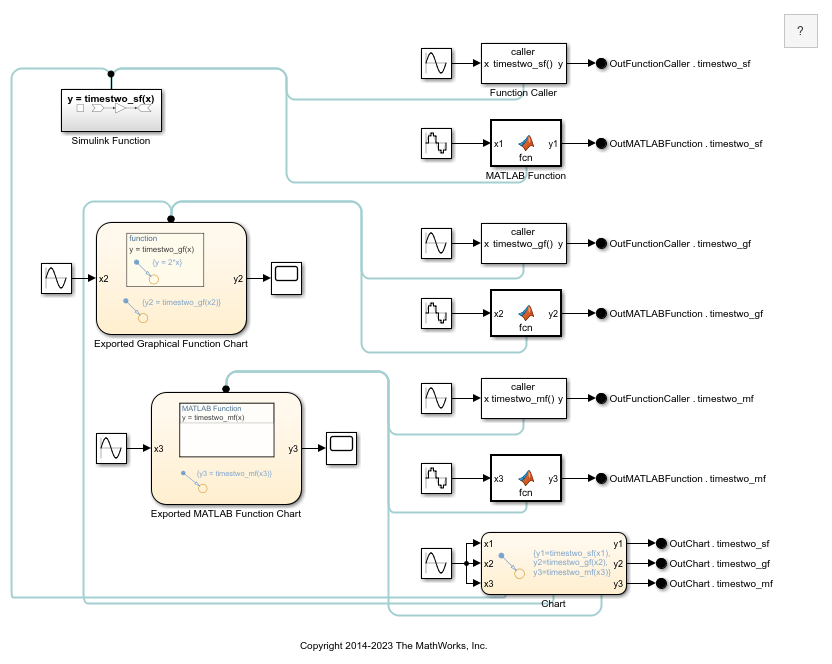
The model defines Simulink functions in the following ways:
Simulink Function block
Stateflow® chart that exports a graphical function
Stateflow chart that exports a MATLAB® function
The model calls each of the Simulink functions in the following ways:
Function Caller block
MATLAB Function block
Stateflow chart
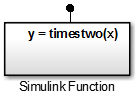
Define Simulink Function Using Simulink Function Block
Set up a Simulink Function block to receive data through an input argument from a function caller, and then return the output through an output argument.
Add a Simulink Function block to your model.
Double-click the text displayed on the block and enter the function prototype.
y =
                            timestwo(x)
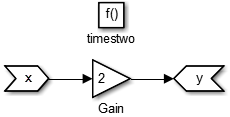
Double-click the block to open the subsystem.
Add a Gain block and set the Gain parameter to
2.
Define Simulink Function Using Exported Function from Stateflow Chart
You can define a Simulink function using a function exported from a Stateflow chart. In a Stateflow chart, you can implement function behavior using a graphical function, MATLAB function, or Simulink function. This section shows how to define and export a graphical function. You can also follow these steps to define and export a MATLAB function or Simulink function.
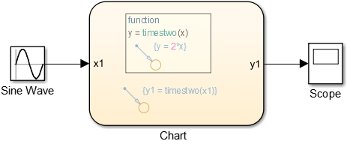
Set up a graphical function in a Stateflow chart to receive data through an input argument from a function caller and then return the output through an output argument. Set chart parameters to export the function to a Simulink model.
Define Graphical Function in Stateflow Chart
Define a graphical function in a Stateflow chart. Specify the function prototype and implement function behavior.
Add a Stateflow Chart to your Simulink model.
Double-click to open the chart.
Add a graphical function. From the left-side toolbar, click and drag the graphical function icon
 onto the chart.
Specify the function prototype. In the function box, replace the
?with the function prototypey = timestwo(x).Implement function behavior. Click the transition arrow and replace the
?with{y = 2*x}.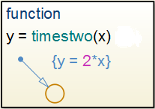
Test Graphical Function
Test the graphical function within the Stateflow chart before exporting to a Simulink model.
Add a default transition in the chart for testing the function. From the left-side toolbar, click and drag a default transition arrow
 onto the chart.
 Double-click the arrow and replace the
?with{y1 = timestwo(x1)}.Add an input port to the chart. Open the Model Explorer. In the left pane, select
Chart. From the menu, select Add > Data. Set Name tox1and Scope toInput.Add an output port to the chart. From the menu, select Add > Data. Set Name to
y1and Scope toOutput.Add a Sine Wave block to provide test data for the input and a Scope block to view results from the output.
Simulate the chart.
Set Argument Parameters for Graphical Function
Specify the size, complexity, and type of the function input and output arguments. A chart can export only functions with fully specified prototypes.
Open the Model Explorer. On the Modeling tab and from the Design section, select Model Explorer
 .
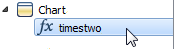
.In the left pane, select the graphical function.
From the Column View list in the middle pane, select
Stateflow. Select the filter icon , and then from the toggle list, select
All Stateflow Objects. From the center pane table,
select an input or output argument.
, and then from the toggle list, select
All Stateflow Objects. From the center pane table,
select an input or output argument.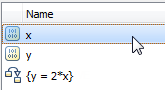
In the right pane, set Size to
1, set Complexity toOff, and set Type todouble.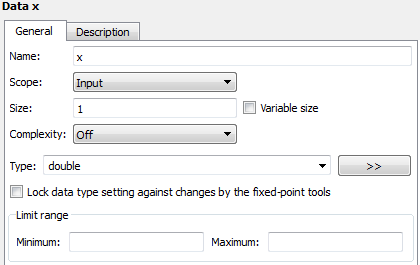
Repeat steps
2and3with the output function argumenty.
Set Export Function Parameters for Graphical Function
Set parameters to export a graphical function to a Simulink model from a Stateflow chart during a simulation.
Open the Model Explorer. In the left pane, select the chart containing the graphical function.
In the Property Inspector, select Export chart level functions and click the Apply button. Then select Treat exported functions as globally visible.
If you are calling the exported graphical function from another Stateflow chart, you do not need to enable the Treat exported functions as globally visible parameter.
For more information, see Export Stateflow Functions for Reuse (Stateflow).
See Also
Simulink Function | Chart (Stateflow) | Argument Inport | Argument Outport | Function Caller