Log or Stream Real-Time Signals by Using the Simulation Data Inspector
With the Simulation Data Inspector and Simulink® Real-Time™, you can send real-time signal data directly to the Simulation Data Inspector, or log signal data by recording it through a File Log block.
If streaming signal data directly, you view the output in real time as the application produces it. But, the application can produce more data than the target computer can transmit in real time to the MATLAB® development computer. Data accumulates in the network buffer, and, if the buffer fills up, the RTOS drops data points.
To avoid dropped data points—caused by network buffer overruns, abnormal MATLAB exit, or computer reboot— log signals on the target computer by connecting the signals to File Log blocks in the model. In the real-time application, these blocks store data for the buffered signals on the target computer. At the end of execution, the real-time application transmits the data to the development computer for display in the Simulation Data Inspector. The file logs are retained until they are discarded or overwritten.
Your workflow for signal data analysis can combine both approaches:
View relevant signals immediately by direct streaming to the Simulation Data Inspector.
View the lossless File Log block logged signals after stopping the recording run.
To keep the Simulation Data Inspector running smoothly, consider reducing the amount of directly streaming signal data by configuring Decimate data, setting Limit data points to last, and adjusting Logging sample time in the Instrumentation Properties dialog box.
Logging signal data through a File Log block supports decimation and supports conditional block execution semantics. Some examples are logging signal data by enabling data logging for a signal inside a for-iterator, function-call, or enabled-triggered subsystem.
For more information, see Simulation Data Inspector and Real-Time Signal Logging is Affected by How Application is Run.
Set Up Model for Logging
To set up the model for logging signal data:
Open model
slrt_ex_osc_rtthat is used in Create and Run Real-Time Application from Simulink Model. To open the model, in the MATLAB Command Window, type:openExample('slrealtime/SlrtCreateAndRunRealTimeAppFromSimulinkModelExample', ... 'supportingFile','slrt_ex_osc_rt.slx');
Connect to the default target computer and configure the model for the target computer. Use these commands in the MATLAB Command Window:
tg = slrealtime;
connect(tg);
model = 'slrt_ex_osc_rt';
modelSTF = getSTFName(tg);
set_param(model,"SystemTargetFile",modelSTF);
If it is not already marked for logging, select the
MuxOutsignal in the model, place your cursor over the signal, and select Log Selected Signal.
Tip
Consider whether to configure the Logging sample time, Decimate data, or Limit data points to last in the Instrumentation Properties for the logged signal. Use these properties to reduce the signal data that goes into the Simulation Data Inspector while the simulation is running. Configuring these properties can help make the Simulation Data Inspector more responsive and easier to use.
Double-click the File Log block. The Decimation value is 1.
Change the model stop time to
Infand ensure that auto import of file logging data is enabled. From the Run on Target button, change the Stop Time toInfand select the AutoImportFileLog checkbox.
Set Up Simulation Data Inspector
To set up the Simulation Data Inspector:
Open the Simulation Data Inspector (
 ).
). Click Layout (
 ).
).Select two horizontal displays.
View Simulation Data
To view the simulation data:
Build and download
slrt_ex_osc_rtthen start real-time execution. From the Real-Time tab in the Simulink editor, with the default target computer connected, click the Run on Target button.After the real-time execution starts and streaming signal data is available, the Simulation Data Inspector button glows
 to indicate that the signal data is ready. Click
the Simulation Data Inspector top display and select the
to indicate that the signal data is ready. Click
the Simulation Data Inspector top display and select the
MuxOut(1)signal.Click in the bottom display and select the
MuxOut(2)signal.To display 1 second of streaming data, use the Zoom in time
 button to a 1 second select time span.
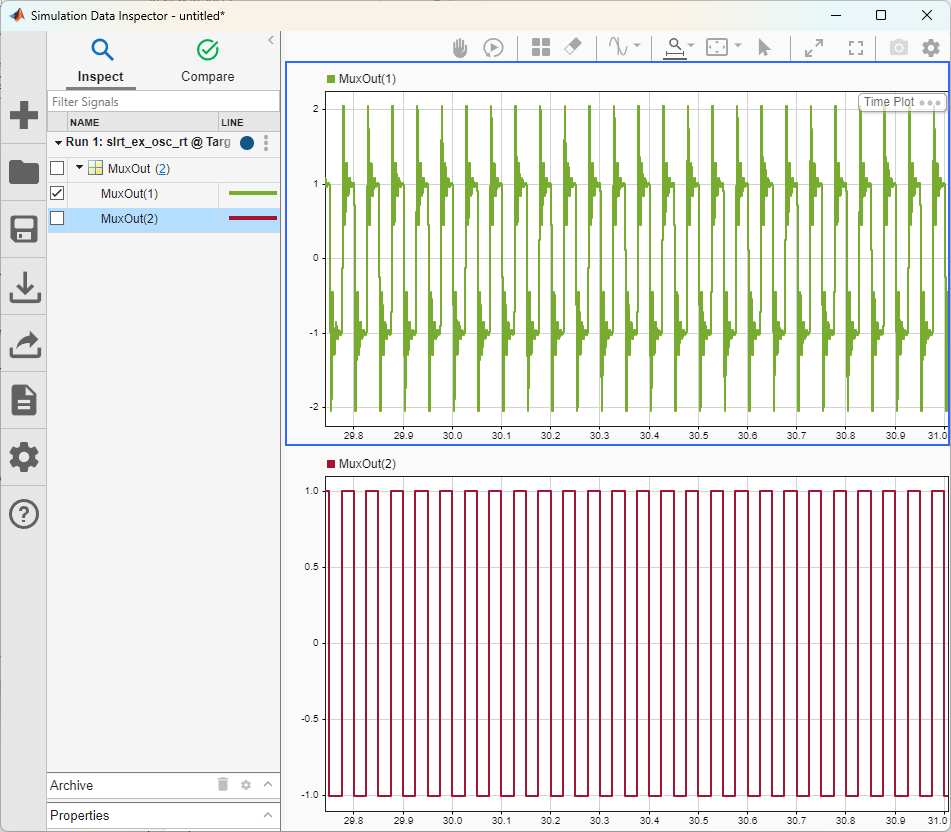
Let the simulation run for a few seconds then stop the run by clicking the Stop Application button on the Real-Time tab in the Simulink editor.
During the run, Simulink Real-Time streamed signal data to the Simulation Data Inspector. After the run because AutoImportFileLog option is enabled in the model, Simulink Real-Time imported the file log signal data to the Simulation Data Inspector and displayed the status message:
Importing Log file 1 of 1 ...
The Simulation Data Inspector button glows
to indicate that the Simulink
Real-Time has imported the file log data. Because the file log was
auto-imported, the file log data merged into the existing run of streamed signal
data. Use the Clear all subplots button
 clear the display.
 Click the Simulation Data Inspector top display and select the
MuxOut(1)logged signal. Click the Simulation Data Inspector bottom display and select theMuxOut(2)logged signal.To display 1 second of streaming data, use the Zoom in time
button to a 1 second select time span.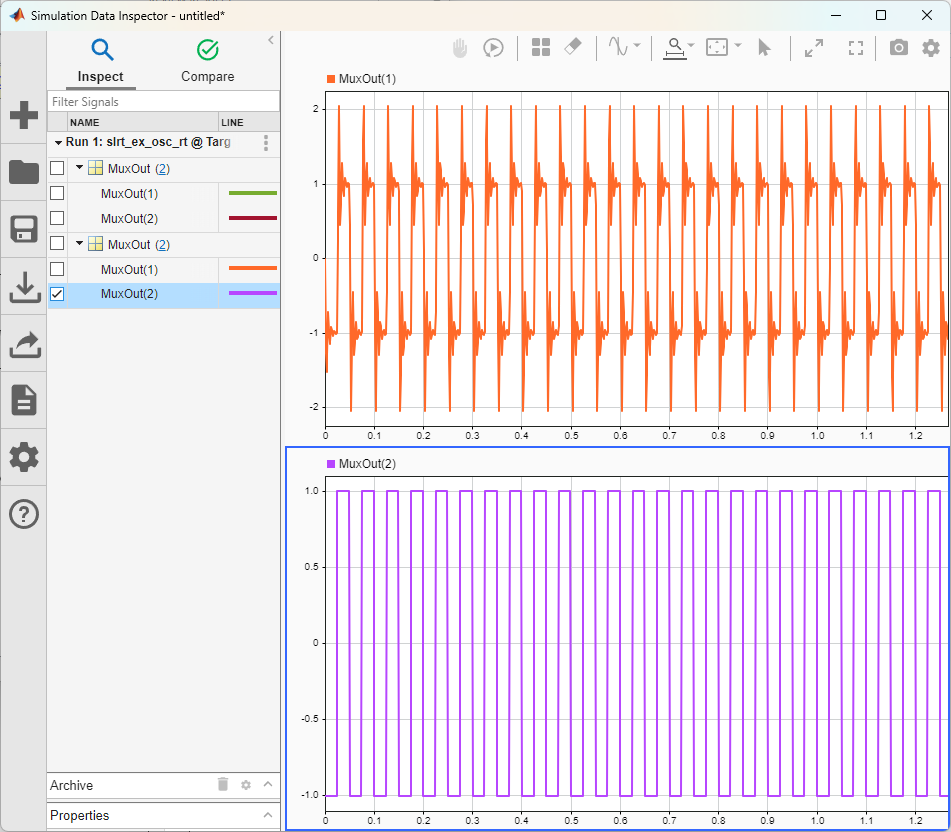
To save the Simulation Data Inspector session as an MLDATX file, click Save.
For more information about file logging and streaming with real-time applications, see Real-Time File Logging and Streaming Workflow.