Main Content

fitsemiself

Label data using semi-supervised self-training method

Since R2020b

    Description

    fitsemiself creates a semi-supervised self-training model given labeled data, labels, and unlabeled data. The returned model contains the fitted labels for the unlabeled data and the corresponding scores. This model can also predict labels for unseen data using the predict object function. For more information on the labeling algorithm, see Algorithms.

    example

    Mdl = fitsemiself(Tbl,ResponseVarName,UnlabeledTbl) uses the labeled data in Tbl, where Tbl.ResponseVarName contains the labels for the labeled data, and returns fitted labels for the unlabeled data in UnlabeledTbl. The function stores the fitted labels and the corresponding scores in the FittedLabels and LabelScores properties of the object Mdl, respectively.

    Mdl = fitsemiself(Tbl,formula,UnlabeledTbl) uses formula to specify the response variable (vector of labels) and the predictor variables to use among the variables in Tbl. The function uses these variables to label the data in UnlabeledTbl.

    Mdl = fitsemiself(Tbl,Y,UnlabeledTbl) uses the predictor data in Tbl and the labels in Y to label the data in UnlabeledTbl.

    example

    Mdl = fitsemiself(X,Y,UnlabeledX) uses the predictor data in X and the labels in Y to label the data in UnlabeledX.

    example

    Mdl = fitsemiself(___,Name,Value) specifies options using one or more name-value pair arguments in addition to any of the input argument combinations in previous syntaxes. For example, you can specify the type of learner, number of iterations, and score threshold to use in the labeling algorithm.

    Examples

    collapse all

    Fit labels to unlabeled data by using a semi-supervised self-training method.

    Randomly generate 60 observations of labeled data, with 20 observations in each of three classes.

    rng('default') % For reproducibility
    
    labeledX = [randn(20,2)*0.25 + ones(20,2);
                randn(20,2)*0.25 - ones(20,2);
                randn(20,2)*0.5];
    Y = [ones(20,1); ones(20,1)*2; ones(20,1)*3];

    Visualize the labeled data by using a scatter plot. Observations in the same class have the same color. Notice that the data is split into three clusters with very little overlap.

    scatter(labeledX(:,1),labeledX(:,2),[],Y,'filled')
    title('Labeled Data')

    Randomly generate 300 additional observations of unlabeled data, with 100 observations per class. For the purposes of validation, keep track of the true labels for the unlabeled data.

    unlabeledX = [randn(100,2)*0.25 + ones(100,2);
                  randn(100,2)*0.25 - ones(100,2);
                  randn(100,2)*0.5];
    trueLabels = [ones(100,1); ones(100,1)*2; ones(100,1)*3];

    Fit labels to the unlabeled data by using a semi-supervised self-training method. The function fitsemiself returns a SemiSupervisedSelfTrainingModel object whose FittedLabels property contains the fitted labels for the unlabeled data and whose LabelScores property contains the associated label scores.

    Mdl = fitsemiself(labeledX,Y,unlabeledX)
    Mdl = 
      SemiSupervisedSelfTrainingModel with properties:
    
                 FittedLabels: [300x1 double]
                  LabelScores: [300x3 double]
                   ClassNames: [1 2 3]
                 ResponseName: 'Y'
        CategoricalPredictors: []
                      Learner: [1x1 classreg.learning.classif.CompactClassificationECOC]


    Visualize the fitted label results by using a scatter plot. Use the fitted labels to set the color of the observations, and use the maximum label scores to set the transparency of the observations. Observations with less transparency are labeled with greater confidence. Notice that observations that lie closer to the cluster boundaries are labeled with more uncertainty.

    maxLabelScores = max(Mdl.LabelScores,[],2);
    rescaledScores = rescale(maxLabelScores,0.05,0.95);
    scatter(unlabeledX(:,1),unlabeledX(:,2),[],Mdl.FittedLabels,'filled', ...
        'MarkerFaceAlpha','flat','AlphaData',rescaledScores);
    title('Fitted Labels for Unlabeled Data')

    Determine the accuracy of the labeling by using the true labels for the unlabeled data.

    numWrongLabels = sum(trueLabels ~= Mdl.FittedLabels)
    numWrongLabels = 7
    

    Only 8 of the 300 observations in unlabeledX are mislabeled.

    Fit labels to unlabeled data by using a semi-supervised self-training method. Specify the type of learner used to fit the labels.

    Load the carsmall data set. Create a table from the variables Acceleration, Displacement, and so on. For each observation, or row in the table, treat the Cylinders value as the label for that observation.

    load carsmall
    Tbl = table(Acceleration,Displacement,Horsepower,Weight,Cylinders);

    Suppose only 20% of the observations are labeled. To recreate this scenario, randomly sample 20 labeled observations and store them in the table unlabeledTbl. Remove the label from the rest of the observations and store them in the table unlabeledTbl. To verify the accuracy of the label fitting at the end of the example, retain the true labels for the unlabeled data in the variable trueLabels.

    rng('default') % For reproducibility of the sampling
    [labeledTbl,Idx] = datasample(Tbl,20,'Replace',false);
    
    unlabeledTbl = Tbl;
    unlabeledTbl(Idx,:) = [];
    trueLabels = unlabeledTbl.Cylinders;
    unlabeledTbl.Cylinders = [];

    Fit labels to the unlabeled data by using a semi-supervised self-training method. Use a multiclass SVM (ECOC) model to iteratively label the unlabeled observations. Specify to standardize the numeric predictors and use a linear kernel function for the SVM binary learners. The function fitsemiself returns an object whose FittedLabels property contains the fitted labels for the unlabeled data.

    Mdl = fitsemiself(labeledTbl,'Cylinders',unlabeledTbl, ...
        'Learner',templateECOC('Learner',templateSVM('Standardize',true, ...
        'KernelFunction','linear')));
    fittedLabels = Mdl.FittedLabels;

    Identify the observations that are incorrectly labeled by comparing the stored true labels for the unlabeled data to the fitted labels returned by the semi-supervised self-training method.

    wrongIdx = (trueLabels ~= fittedLabels);
    wrongTbl = unlabeledTbl(wrongIdx,:);

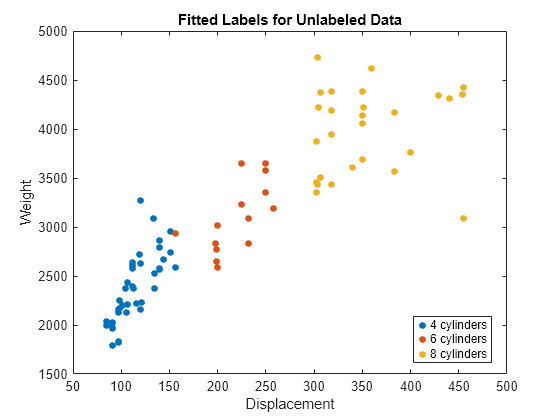
    Visualize the fitted label results for the unlabeled data. Mislabeled observations are circled in the plot.

    gscatter(unlabeledTbl.Displacement,unlabeledTbl.Weight, ...
        fittedLabels)
    hold on
    plot(wrongTbl.Displacement,wrongTbl.Weight, ...
        'ko','MarkerSize',8)
    xlabel('Displacement')
    ylabel('Weight')
    legend('4 cylinders','6 cylinders','8 cylinders')
    title('Fitted Labels for Unlabeled Data')
    hold off

    Input Arguments

    collapse all

    Labeled sample data, specified as a table. Each row of Tbl corresponds to one observation, and each column corresponds to one predictor. Optionally, Tbl can contain one additional column for the response variable (vector of labels). Multicolumn variables and cell arrays other than cell arrays of character vectors are not supported.

    If Tbl contains the response variable, and you want to use all remaining variables in Tbl as predictors, then specify the response variable using ResponseVarName.

    If Tbl contains the response variable, and you want to use only a subset of the remaining variables in Tbl as predictors, specify a formula using formula.

    If Tbl does not contain the response variable, specify a response variable using Y. The length of the response variable and the number of rows in Tbl must be equal.

    Data Types: table

    Unlabeled sample data, specified as a table. Each row of UnlabeledTbl corresponds to one observation, and each column corresponds to one predictor. UnlabeledTbl must contain the same predictors as those contained in Tbl.

    Data Types: table

    Response variable name, specified as the name of a variable in Tbl. The response variable contains the class labels for the sample data in Tbl.

    You must specify ResponseVarName as a character vector or string scalar. For example, if the response variable Y is stored as Tbl.Y, then specify it as 'Y'. Otherwise, the software treats all columns of Tbl, including Y, as predictors.

    The response variable must be a categorical, character, or string array, a logical or numeric vector, or a cell array of character vectors. If Y is a character array, then each element of the response variable must correspond to one row of the array.

    A good practice is to specify the order of the classes by using the ClassNames name-value pair argument.

    Data Types: char | string

    Explanatory model of the response variable and a subset of the predictor variables, specified as a character vector or string scalar in the form 'Y~X1+X2+X3'. In this form, Y represents the response variable, and X1, X2, and X3 represent the predictor variables.

    To specify a subset of variables in Tbl as predictors, use a formula. If you specify a formula, then the software does not use any variables in Tbl that do not appear in formula.

    The variable names in the formula must be both variable names in Tbl (Tbl.Properties.VariableNames) and valid MATLAB® identifiers. You can verify the variable names in Tbl by using the isvarname function. If the variable names are not valid, then you can convert them by using the matlab.lang.makeValidName function.

    Data Types: char | string

    Class labels, specified as a numeric, categorical, or logical vector, a character or string array, or a cell array of character vectors.

    • If Y is a character array, then each element of the class labels must correspond to one row of the array.

    • The length of Y must be equal to the number of rows in Tbl or X.

    • A good practice is to specify the class order by using the ClassNames name-value pair argument.

    Data Types: single | double | categorical | logical | char | string | cell

    Labeled predictor data, specified as a numeric matrix.

    By default, each row of X corresponds to one observation, and each column corresponds to one predictor.

    The length of Y and the number of observations in X must be equal.

    To specify the names of the predictors in the order of their appearance in X, use the PredictorNames name-value pair argument.

    Data Types: single | double

    Unlabeled predictor data, specified as a numeric matrix. By default, each row of UnlabeledX corresponds to one observation, and each column corresponds to one predictor. UnlabeledX must have the same predictors as X, in the same order.

    Data Types: single | double

    Note

    The software treats NaN, empty character vector (''), empty string (""), <missing>, and <undefined> elements as missing data. Whether the software removes observations with missing values depends on the underlying classifier type (Learner).

    Name-Value Arguments

    Specify optional pairs of arguments as Name1=Value1,...,NameN=ValueN, where Name is the argument name and Value is the corresponding value. Name-value arguments must appear after other arguments, but the order of the pairs does not matter.

    Before R2021a, use commas to separate each name and value, and enclose Name in quotes.

    Example: fitsemiself(Tbl,'Y',UnlabeledTbl,'Learner',templateSVM('Standardize',true),'IterationLimit',2e3) specifies to use a binary support vector machine (SVM) learner, standardize the numeric predictors, and run a maximum of 2000 iterations.

    Underlying classifier type, specified as the comma-separated pair consisting of 'Learner' and one of the values in this table.

    ValueDescription
    'discriminant' or templateDiscriminant objectDiscriminant analysis classifier
    templateECOC objectMulticlass error-correcting output codes (ECOC) model — templateECOC('Learners',templateSVM('KernelFunction','gaussian')) is the default for multiclass classification.
    templateEnsemble objectEnsemble classification model
    'kernel' or templateKernel objectKernel classification model (for binary classification only)
    'knn' or templateKNN objectk-nearest neighbor model
    'linear' or templateLinear objectLinear classification model (for binary classification only)
    'svm' or templateSVM objectSupport vector machine (SVM) classifier (for binary classification only) — templateSVM('KernelFunction','gaussian') is the default for binary classification.
    'tree' or templateTree objectBinary decision classification tree

    Example: 'Learner','tree'

    Example: 'Learner',templateEnsemble('AdaBoostM1',100,'tree')

    Maximum number of self-training iterations, specified as the comma-separated pair consisting of 'IterationLimit' and a positive integer scalar. The fitsemiself function returns Mdl, which contains the fitted labels and scores, when this limit is reached, even if the algorithm does not converge.

    Example: 'IterationLimit',2e3

    Data Types: single | double

    Score threshold for fitted labels, specified as the comma-separated pair consisting of 'ScoreThreshold' and a numeric scalar. At each iteration of the algorithm, the software makes label predictions for the unlabeled observations by using the specified Learner, and calculates scores for these predictions. Unlabeled observations with prediction scores greater than or equal to the score threshold are treated as labeled observations in the next iteration, where the label is the predicted label. By default, ScoreThreshold is 0.1 for binary classification and –0.1 for multiclass classification.

    Example: 'ScoreThreshold',0.2

    Data Types: single | double

    Categorical predictors list, specified as one of the values in this table. The descriptions assume that the predictor data has observations in rows and predictors in columns.

    ValueDescription
    Vector of positive integers

    Each entry in the vector is an index value indicating that the corresponding predictor is categorical. The index values are between 1 and p, where p is the number of predictors used to train the model.

    If fitsemiself uses a subset of input variables as predictors, then the function indexes the predictors using only the subset. The CategoricalPredictors values do not count the response variable, observation weights variable, or any other variables that the function does not use.

    Logical vector

    A true entry means that the corresponding predictor is categorical. The length of the vector is p.

    Character matrixEach row of the matrix is the name of a predictor variable. The names must match the entries in PredictorNames. Pad the names with extra blanks so each row of the character matrix has the same length.
    String array or cell array of character vectorsEach element in the array is the name of a predictor variable. The names must match the entries in PredictorNames.
    "all"All predictors are categorical.

    By default, if the predictor data is in a table, fitsemiself assumes that a variable is categorical if it is a logical vector, categorical vector, character array, string array, or cell array of character vectors. However, learners that use decision trees assume that mathematically ordered categorical vectors are continuous variables. If the predictor data is a matrix, fitsemiself assumes that all predictors are continuous. To identify any other predictors as categorical predictors, specify them by using the 'CategoricalPredictors' name-value pair argument.

    For more information on how different fitting functions and, therefore, different learners treat categorical predictors, see Automatic Creation of Dummy Variables.

    Example: 'CategoricalPredictors','all'

    Data Types: single | double | logical | char | string | cell

    Names of the classes to use for labeling, specified as the comma-separated pair consisting of 'ClassNames' and a categorical, character, or string array, a logical or numeric vector, or a cell array of character vectors. ClassNames must have the same data type as Y.

    If ClassNames is a character array, then each element must correspond to one row of the array.

    Use 'ClassNames' to:

    • Order the classes.

    • Specify the order of any input or output argument dimension that corresponds to the class order. For example, use 'ClassNames' to specify the column order of classification scores in Mdl.LabelScores.

    • Select a subset of classes for labeling. For example, suppose that the set of all distinct class names in Y is {'a','b','c'}. To train the underlying classifier Learner using observations from classes 'a' and 'c' only, specify 'ClassNames',{'a','c'}.

    The default value for ClassNames is the set of all distinct class names in Y.

    Example: 'ClassNames',{'b','g'}

    Data Types: categorical | char | string | logical | single | double | cell

    Predictor variable names, specified as the comma-separated pair consisting of 'PredictorNames' and a string array of unique names or cell array of unique character vectors. The functionality of 'PredictorNames' depends on the way you supply predictor data.

    • If you supply X, Y, and UnlabeledX, then you can use 'PredictorNames' to assign names to the predictor variables in X and UnlabeledX.

      • The order of the names in PredictorNames must correspond to the column order of X. Assuming that X has the default orientation, with observations in rows and predictors in columns, PredictorNames{1} is the name of X(:,1), PredictorNames{2} is the name of X(:,2), and so on. Also, size(X,2) and numel(PredictorNames) must be equal.

      • By default, PredictorNames is {'x1','x2',...}.

    • If you supply Tbl and UnlabeledTbl, then you can use 'PredictorNames' to choose which predictor variables to use. That is, fitsemiself uses only the predictor variables in PredictorNames and the response variable to label the unlabeled data.

      • PredictorNames must be a subset of Tbl.Properties.VariableNames and cannot include the name of the response variable.

      • By default, PredictorNames contains the names of all predictor variables.

      • A good practice is to specify the predictors using either 'PredictorNames' or formula, but not both.

    Example: 'PredictorNames',{'SepalLength','SepalWidth','PetalLength','PetalWidth'}

    Data Types: string | cell

    Response variable name, specified as the comma-separated pair consisting of 'ResponseName' and a character vector or string scalar.

    • If you supply Y, then you can use 'ResponseName' to specify a name for the response variable.

    • If you supply ResponseVarName or formula, then you cannot use 'ResponseName'.

    Example: 'ResponseName','response'

    Data Types: char | string

    Number of bins for the numeric predictors, specified as the comma-separated pair consisting of 'NumBins' and a positive integer scalar.

    • If the 'NumBins' value is empty (default), then the software does not bin any predictors.

    • If you specify the 'NumBins' value as a positive integer scalar, then the software bins every numeric predictor into a specified number of equiprobable bins, and then grows trees on the bin indices instead of the original data.

      • If the 'NumBins' value exceeds the number (u) of unique values for a predictor, then fitsemiself bins the predictor into u bins.

      • fitsemiself does not bin categorical predictors.

      When you use a large data set, this binning option speeds up classifier training, but causes a potential decrease in accuracy. You can try 'NumBins',50 first, and then change the 'NumBins' value depending on the accuracy and training speed.

    Note

    This argument is valid only when the Learner value is a templateECOC or templateEnsemble object that uses tree learners.

    Example: 'NumBins',50

    Data Types: single | double

    Observation dimension for the predictor data X and UnlabeledX, specified as the comma-separated pair consisting of 'ObservationsIn' and 'rows' or 'columns'. For linear classification models, if you orient X and UnlabeledX so that observations correspond to columns and specify 'ObservationsIn','columns', then you can experience a reduction in execution time.

    Note

    The 'columns' value is valid only when the Learner value is a binary linear classification model ('linear' or templateLinear) or an ECOC model with linear binary learners (for example, templateECOC('Learners','linear').

    Example: 'ObservationsIn','columns'

    Data Types: char | string

    Output Arguments

    collapse all

    Semi-supervised self-training classifier, returned as a SemiSupervisedSelfTrainingModel object. Use dot notation to access the object properties. For example, to get the fitted labels for the unlabeled data and their corresponding scores, enter Mdl.FittedLabels and Mdl.LabelScores, respectively.

    Algorithms

    The algorithm begins by training a user-specified classifier (Learner), first trained on the labeled data alone, and then uses that classifier to make label predictions for the unlabeled data. Next, the algorithm provides scores for the predictions, and then treats the predictions as true labels for the next training cycle of the classifier if the scores are above a threshold (ScoreThreshold). This process repeats until the label predictions converge or the iteration limit (IterationLimit) is reached.

    References

    [1] Abney, Steven. “Understanding the Yarowsky Algorithm.” Computational Linguistics 30, no. 3 (September 2004): 365–95. https://doi.org/10.1162/0891201041850876.

    [2] Yarowsky, David. “Unsupervised Word Sense Disambiguation Rivaling Supervised Methods.” Proceedings of the 33rd Annual Meeting of the Association for Computational Linguistics, 189–96. Cambridge, Massachusetts: Association for Computational Linguistics, 1995. https://doi.org/10.3115/981658.981684.

    Version History

    Introduced in R2020b