findPointsInModel
Description
Examples
Load a MAT file containing point cloud data into the workspace.
load("object3d.mat")Visualize the point cloud.
figure
pcshow(ptCloud)

Define a region of interest (ROI) in the point cloud in which to detect a cylinder model.
roi = [0.4 0.7; -0.1 0.2; 0 0.4];
sampleIndices = findPointsInROI(ptCloud,roi);
Set a maximum point-to-cylinder distance of 5 mm for cylinder fitting and the orientation constraint.
maxDistance = 0.005;
referenceVector = [0 0 1];
Detect a cylinder in the point cloud.
 model = pcfitcylinder(ptCloud,maxDistance,referenceVector, ...
        SampleIndices=sampleIndices);
Create a synthetic point cloud that is evenly distributed and covers the region of interest.
gridStep = 0.005;
[x,y,z] = meshgrid(roi(1,1):gridStep:roi(1,2),roi(2,1):gridStep:roi(2,2), ...
roi(3,1):gridStep:roi(3,2));
syntheticPtCloud = pointCloud([x(:) y(:) z(:)],Color=[0.7 0.7 0.8]);
Find the points in the synthetic point cloud that are in the cylinder.
idx = findPointsInModel(model,syntheticPtCloud);
cylinderPtCloud = select(syntheticPtCloud,idx);
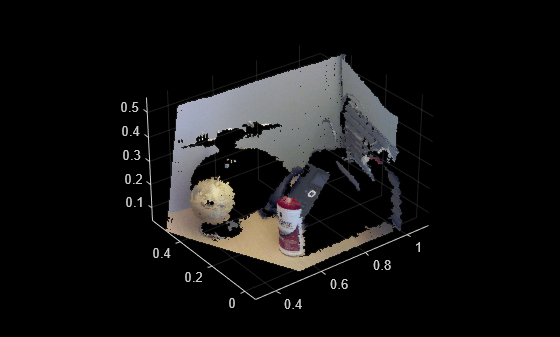
Visualize the resulting point cloud, with the synthetic points in the cylinder modeling the object on the table.
figure
pcshow(cylinderPtCloud)
hold on
pcshow(ptCloud)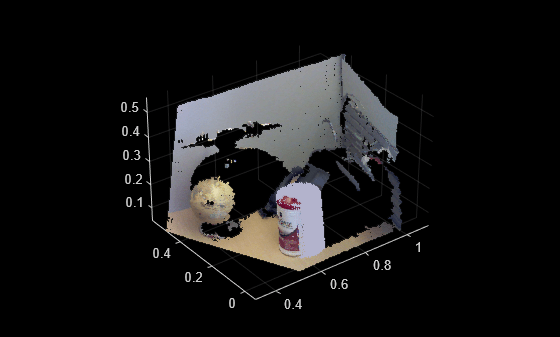
Load a MAT file containing a point cloud into the workspace.
load("object3d.mat")Visualize the point cloud.
figure
pcshow(ptCloud)
Define a region of interest (ROI) in the point cloud in which to detect a sphere model.
roi = [0.2 0.55; 0.2 0.5; 0 0.5];
sampleIndices = findPointsInROI(ptCloud,roi);
Set a maximum point-to-sphere distance of 5mm for sphere fitting.
maxDistance = 0.005;
Detect the sphere in the point cloud.
[model,inlierIdx] = pcfitsphere(ptCloud,maxDistance,SampleIndices=sampleIndices);
Find one of the colors in the detected sphere, to use for the synthetic point cloud.
inlierPtCloud = select(ptCloud,inlierIdx);
color = median(inlierPtCloud.Color);
Create a synthetic point cloud that is evenly distributed and covers the region of interest.
gridStep = 0.005;
[x,y,z] = meshgrid(roi(1,1):gridStep:roi(1,2),roi(2,1):gridStep:roi(2,2), ...
roi(3,1):gridStep:roi(3,2));
syntheticPtCloud = pointCloud([x(:) y(:) z(:)],Color=color);
Find the points in the synthetic point cloud that are in the sphere.
idx = findPointsInModel(model,syntheticPtCloud);
spherePtCloud = select(syntheticPtCloud,idx);
Visualize the resulting point cloud, with the synthetic points in the sphere modeling the object on the table.
figure
pcshow(spherePtCloud)
hold on
pcshow(ptCloud)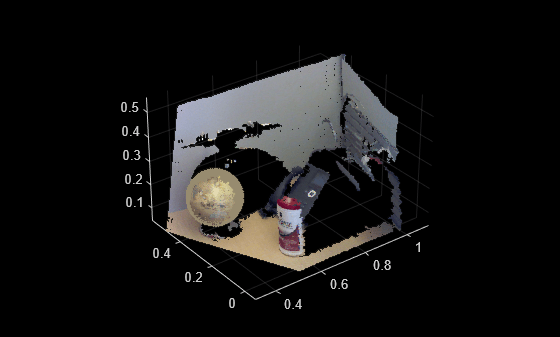
Input Arguments
Output Arguments
Version History
Introduced in R2024a