Main Content

plot

Plot 3-D map points and estimated camera trajectory in visual SLAM

Since R2023b

    Description

    example

    plot(vslam) plots the 3-D map points and estimated camera trajectory from the visual SLAM object vslam.

    plot(vslam,Name=Value) specifies options using one or more name-value arguments. For example, MarkerSize=10 sets the diameter of the marker size to 10 points.

    ax = plot(___) returns the axes handle for the 3-D mapped points of the plot, using any combination of input arguments from previous syntaxes.

    Examples

    collapse all

    Perform monocular visual simultaneous localization and mapping (vSLAM) using the data from the TUM RGB-D Benchmark. You can download the data to a temporary directory using a web browser or by running this code:

    baseDownloadURL = "https://cvg.cit.tum.de/rgbd/dataset/freiburg3/rgbd_dataset_freiburg3_long_office_household.tgz"; 
    dataFolder = fullfile(tempdir,"tum_rgbd_dataset",filesep); 
    options = weboptions(Timeout=Inf);
    tgzFileName = dataFolder+"fr3_office.tgz";
    folderExists = exist(dataFolder,"dir");
    
    % Create a folder in a temporary directory to save the downloaded file
    if ~folderExists  
        mkdir(dataFolder) 
        disp("Downloading fr3_office.tgz (1.38 GB). This download can take a few minutes.") 
        websave(tgzFileName,baseDownloadURL,options); 
        
        % Extract contents of the downloaded file
        disp("Extracting fr3_office.tgz (1.38 GB) ...") 
        untar(tgzFileName,dataFolder); 
    end

    Create an imageDatastore object to store all the RGB images.

    imageFolder = dataFolder+"rgbd_dataset_freiburg3_long_office_household/rgb/";
    imds = imageDatastore(imageFolder);

    Specify your camera intrinsic parameters, and use them to create a monocular visual SLAM object.

    intrinsics = cameraIntrinsics([535.4 539.2],[320.1 247.6],[480 640]);
    vslam = monovslam(intrinsics);

    Process each image frame, and visualize the camera poses and 3-D map points.

    for i = 1:numel(imds.Files)
        addFrame(vslam,readimage(imds,i))
    
        if hasNewKeyFrame(vslam)
            % Query 3-D map points and camera poses
            xyzPoints = mapPoints(vslam);
            [camPoses,viewIds] = poses(vslam);
    
            % Display 3-D map points and camera trajectory
            plot(vslam);
        end
    
        % Get current status of system
        status = checkStatus(vslam);
    end 

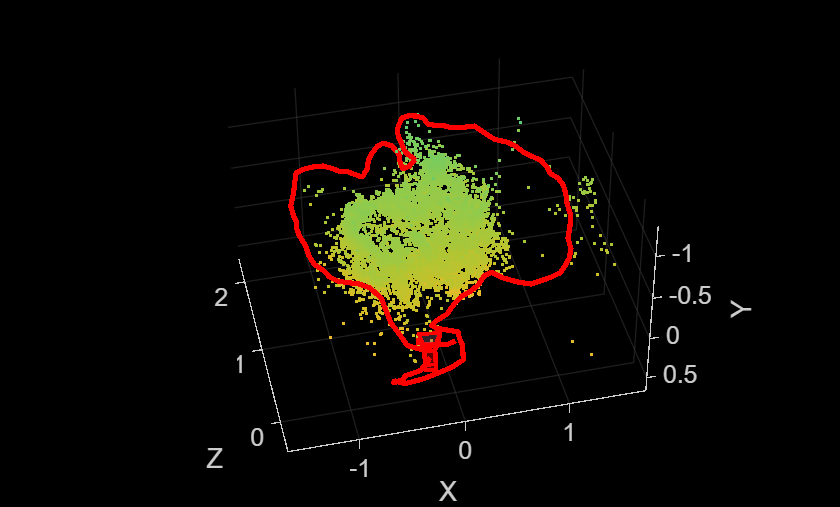
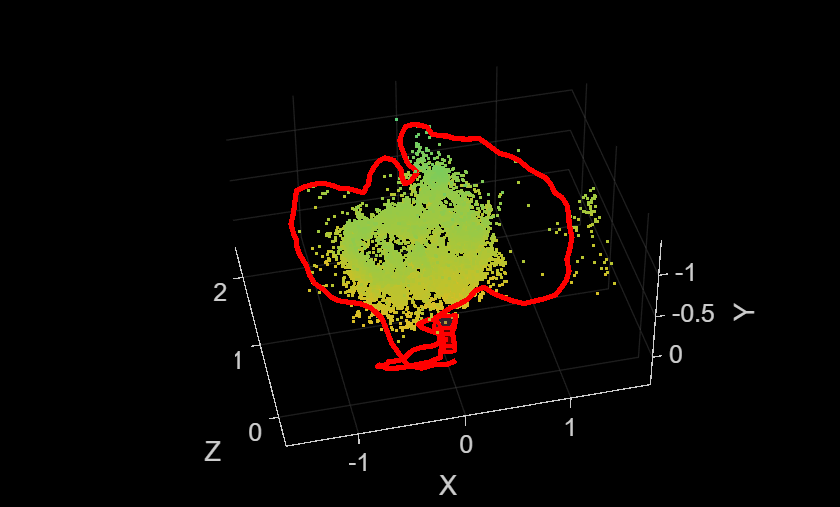
    Figure contains an axes object. The axes object with xlabel X, ylabel Y contains 12 objects of type line, text, patch, scatter. This object represents Camera trajectory.

    Note that the monovslam object runs several algorithm parts on separate threads, which can introduce a latency in processing of an image frame added by using the addFrame function.

    % Plot intermediate results and wait until all images are processed
    while ~isDone(vslam)
        if hasNewKeyFrame(vslam)
            plot(vslam);
        end
    end

    After all the images are processed, you can collect the final 3-D map points and camera poses for further analysis.

    xyzPoints = mapPoints(vslam);
    [camPoses,viewIds] = poses(vslam);
    
    % Reset the system
    reset(vslam)

    Input Arguments

    collapse all

    Visual SLAM object, specified as a monovslam object.

    Name-Value Arguments

    Specify optional pairs of arguments as Name1=Value1,...,NameN=ValueN, where Name is the argument name and Value is the corresponding value. Name-value arguments must appear after other arguments, but the order of the pairs does not matter.

    Example: plot(vslam,MarkerSize=10), sets the diameter of the marker to 10 points.

    Diameter of markers for 3-D map points, specified as a positive integer in points.

    Color of markers for 3-D map points, specified as an RGB triplet or a short or long color name. Each value within an RGB triplet must be in the range [0, 1]

    Colormap source for markers, specified as "X", "Y", "Z", or "MarkerColor".

    Width of the camera base, specified as a scalar in the data units of the axes.

    Color of the camera, specified as an RGB triplet or a short or long color name. Each value within an RGB triplet must be in the range [0, 1].

    Axes for visualization, specified as an Axes object or a UIAxes object. Use this name-value argument to visualize the plot in a UI for which you have specified Figure and Axes properties.

    Output Arguments

    collapse all

    Axes handle, returned as an axes graphics object

    Version History

    Introduced in R2023b