paths
Scattering network paths
Description
Examples
Create two wavelet scattering networks, both for a signal of length 500. In the second network, set the OptimizePath value to true.
sf = waveletScattering(SignalLength=500);
sfOpt = waveletScattering(SignalLength=500, ...
    OptimizePath=true);
Obtain the path information of the default and path-optimized networks. Determine the total number of scattering paths in both networks.
[spaths,npaths] = paths(sf);
[spathsOpt,npathsOpt] = paths(sfOpt);
fprintf('Default Network: %d paths\nOptimized Network: %d paths\n', ...
    sum(npaths),sum(npathsOpt));
Default Network: 65 paths
Optimized Network: 52 paths
Both networks have two filter banks. Visualize the scattering paths that include the wavelets in the second filter bank. Create a directed graph. For every wavelet filter that is on at least one path, label the corresponding node as waveletNumber.filterbank. For each path, connect the corresponding nodes. Use the helper function helperPlotScatteringGraph to construct the graphs. Plot the graphs of both networks.
scatGraph = helperPlotScatteringGraph(spaths);
plot(scatGraph)
title({"Scattering Paths", ...
    "OptimizePath: "+num2str(sf.OptimizePath)})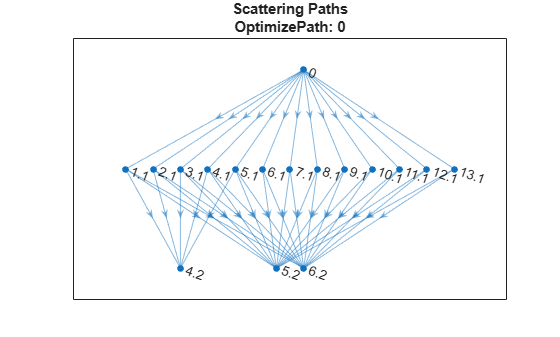
figure
scatGraphOpt = helperPlotScatteringGraph(spathsOpt);
plot(scatGraphOpt)
title({"Scattering Paths", ...
    "OptimizePath: "+num2str(sfOpt.OptimizePath)})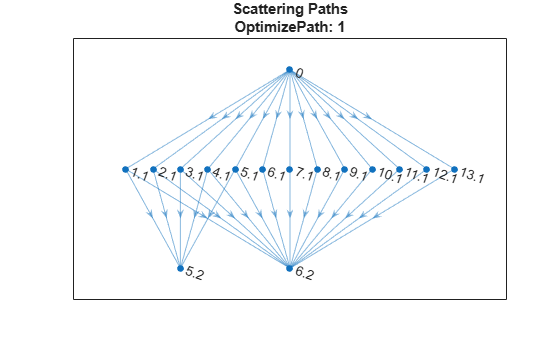
Supporting Functions
plotScatteringGraph
function dirGraph = helperPlotScatteringGraph(networkPaths)
% This function is intended for use only in this example.
% It may change or be removed in a future release.

path = networkPaths{3}.path;
% Set to 0 if want to plot the multiple paths between 0 and each
% first level node
mkunique = 1;

if mkunique == 1
    f1 = path(:,1:2);
    c = unique(f1,'rows');
else
    c = path(:,1:2);
end

p1 = string(c(:,1));
p2 = string(c(:,2)+.1);
p3 = string(path(:,2)+.1);
p4 = string(path(:,3)+.2);
dirGraph = digraph([p1;p3],[p2;p4]);

end
Since R2025b
Create two wavelet scattering networks, both for a signal of length 500. The default value of the network property FilterDownsampling is "fullband". In the second network, set FilterDownsampling to "bandlimited".
sfFull = waveletScattering(SignalLength=500);
sfBand = waveletScattering(SignalLength=500, ...
    FilterDownsampling="bandlimited");
Use the object function filterbank to obtain the filter bank metadata from both networks. Compare the downsampling factors of the wavelet filters in the first filter bank. Confirm that the filters in the network sfBand have been downsampled less than the filters in sfFull.
fb = 1;
[~,~,metaDataFull] = filterbank(sfFull);
[~,~,metaDataBand] = filterbank(sfBand);
downSamplingFactors.full = metaDataFull{fb+1}.psilog2ds;
downSamplingFactors.band = metaDataBand{fb+1}.psilog2ds;
plot(downSamplingFactors.full,'x-')
hold on
plot(downSamplingFactors.band,'o-')
hold off
grid on
title("First Filter Bank Downsampling Factors")
xlabel("Wavelet Filter Index")
ylabel({"Downsampling Factor", ...
    "(Base-2 Logarithmic Scale)"})
legend("""fullband"" Network", ...
    """halfband"" Network", ...
    Location="northwest")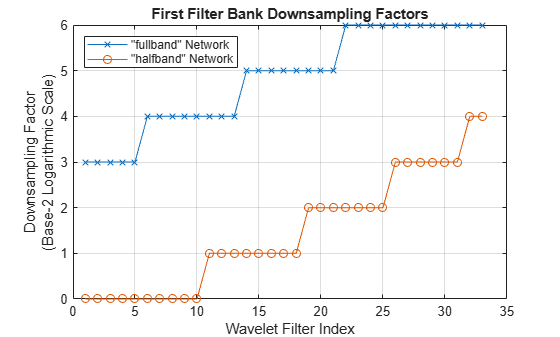
Obtain the path information of both networks. Determine the total number of scattering paths in both networks.The outputs of the first filter bank in the network sfBand are less downsampled than the first filter bank outputs in the network sfFull. The result is that sfBand has a greater number of scattering paths than the sfFull network.
[spathsFull,npathsFull] = paths(sfFull);
[spathsBand,npathsBand] = paths(sfBand);
fprintf("""fullband"" Network: %d paths\n", ...
    sum(npathsFull))
"fullband" Network: 65 paths
fprintf("""bandlimited"" Network: %d paths\n", ...
    sum(npathsBand))
"bandlimited" Network: 159 paths
Visualize the scattering paths in both networks that include the wavelets in the second filter bank. Create a directed graph. For every wavelet filter that is on at least one path, label the corresponding node as waveletNumber.filterbank. For each path, connect the corresponding nodes. Use the helper function helperPlotScatteringGraph to construct the graphs. Plot the graphs of both networks.
scatGraphFull = helperPlotScatteringGraph(spathsFull);
plot(scatGraphFull)
title("Scattering Paths: ""Fullband""")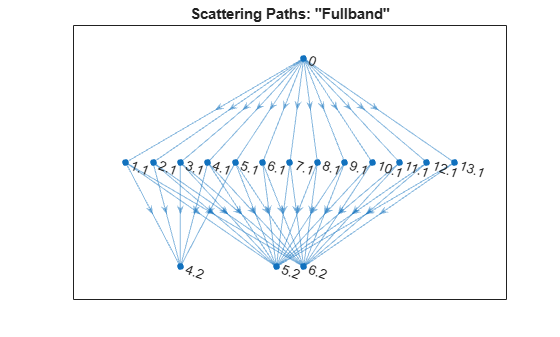
figure
scatGraphBand = helperPlotScatteringGraph(spathsBand);
plot(scatGraphBand)
title("Scattering Paths: ""Bandlimited""")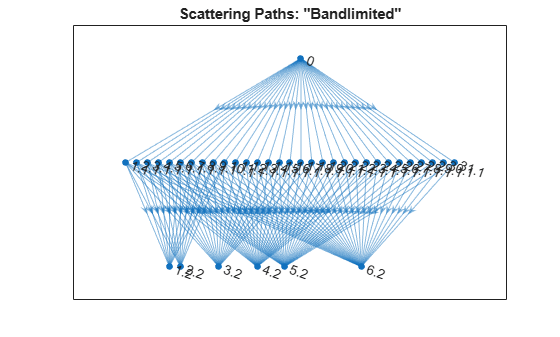
Supporting Functions
plotScatteringGraph
function dirGraph = helperPlotScatteringGraph(networkPaths)
% This function is intended for use only in this example.
% It may change or be removed in a future release.

path = networkPaths{3}.path;
% Set to 0 if want to plot the multiple paths between 0 and each
% first level node
mkunique = 1;

if mkunique == 1
    f1 = path(:,1:2);
    c = unique(f1,'rows');
else
    c = path(:,1:2);
end

p1 = string(c(:,1));
p2 = string(c(:,2)+.1);
p3 = string(path(:,2)+.1);
p4 = string(path(:,3)+.2);
dirGraph = digraph([p1;p3],[p2;p4]);

end
Input Arguments
Output Arguments
Extended Capabilities
Version History
Introduced in R2021a