Difficult to help unless you provide more information. For example, upload example images and describe your desired output in better detail.
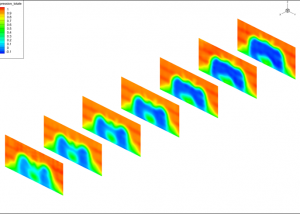
how to plot slice graph from several png files
6 visualizaciones (últimos 30 días)
Mostrar comentarios más antiguos
Hello Everybody I have several png files that show displacement varying with time, for a nice visualization I thought that making a slice graph could be a nice idea, I didn't find any example helping me, I would appreciate any help.Thank you
3 comentarios
Ver también
Categorías
Más información sobre Lighting, Transparency, and Shading en Help Center y File Exchange.
Community Treasure Hunt
Find the treasures in MATLAB Central and discover how the community can help you!
Start Hunting!
Translated by ![]()
También puede seleccionar uno de estos países/idiomas:
América
- América Latina (Español)
- Canada (English)
- United States (English)
Europa
- Belgium (English)
- Denmark (English)
- Deutschland (Deutsch)
- España (Español)
- Finland (English)
- France (Français)
- Ireland (English)
- Italia (Italiano)
- Luxembourg (English)
- Netherlands (English)
- Norway (English)
- Österreich (Deutsch)
- Portugal (English)
- Sweden (English)
- Switzerland
- United Kingdom(English)
Asia-Pacífico
- Australia (English)
- India (English)
- New Zealand (English)
- 中国
- 日本Japanese (日本語)
- 한국Korean (한국어)