Resultados de
This person used computer version to build a keyboard input, and used standard flag semaphore for the positions.
Flag semaphore is used mostly by sailors to be able to communicate optically over a distance; it does not need anything more than make-shift flags (but binoculars or telescopes can help.) Trained users can go faster than you might guess.
Chen, Rena, and I are at a community management event. It's great to be with others talking about relationships, trust, and co-creation.
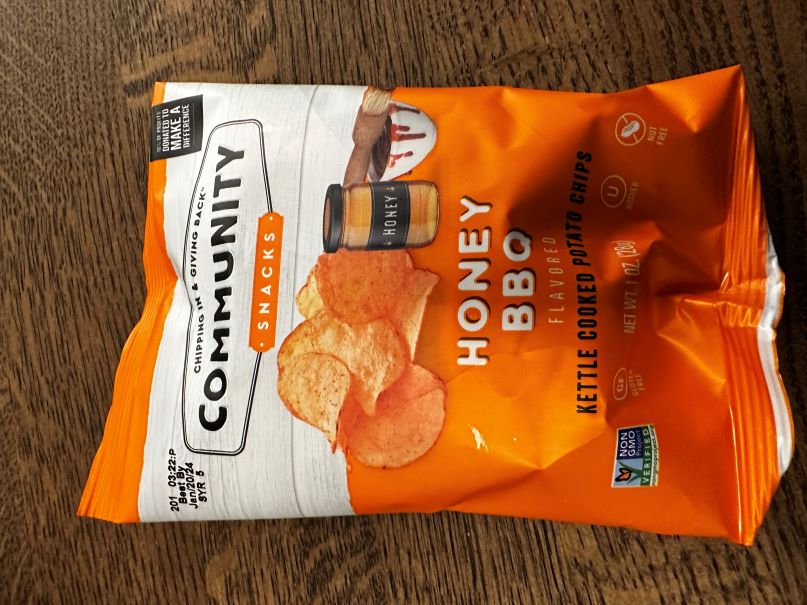
I'm in a community conference in Boston today and see what snacks we get! The organizer said it's a coincidence, but it's definitly a good idea to have them in our MathWorks community meetings.
A research team found a way to trick a number of AI systems by injecting carefully placed nonsense -- for example being able able to beat DeepMind's Go game.
This video discusses the "Cody" bridge, which is a pedestrian bridge over a canal that has been designed to move up and out of the way when ships need to travel through. The mathematics of the bridge movement are discussed and diagrammed. It is unique and educational.
Recently developed: a "microscope" based on touch and stereo vision.
Using touch removes the possibility of optical confusion -- for example, black on touch is only due to shape, not due to the possibility that the object has a black patch.
Sorry, you might need a Facebook account to watch the video.

(Sorry - it should be 2023b by now.)
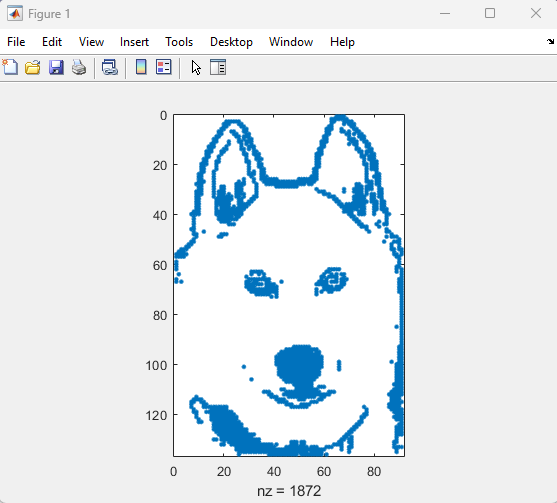
spy
I'm curious how the community uses the hold command when creating charts and graphics in MATLAB. In short, hold on sets up the axes to add new objects to the axes while hold off sets up the axes to reset when new objects are added.
When you use hold on do you always follow up with hold off? What's your reasoning on this decision?
Can't wait to discuss this here! I'd love to hear from newbies and experts alike!
The way we've solved ODEs in MATLAB has been relatively unchanged at the user-level for decades. Indeed, I consider ode45 to be as iconic as backslash! There have been a few new solvers in recent years -- ode78 and ode89 for example -- and various things have gotten much faster but if you learned how to solve ODEs in MATLAB in 1997 then your knowledge is still applicable today.
In R2023b, there's a completely new framework for solving ODEs and I love it! You might argue that I'm contractually obliged to love it since I'm a MathWorker but I can assure you this is the real thing!
I wrote it up in a tutorial style on The MATLAB Blog https://blogs.mathworks.com/matlab/2023/10/03/the-new-solution-framework-for-ordinary-differential-equations-odes-in-matlab-r2023b/
The new interface makes a lot of things a much easier to do. Its also setting us up for a future where we'll be able to do some very cool algorithmic stuff behind the scenes.
Let me know what you think of the new functionality and what you think MathWorks should be doing next in the area of ODEs.
4 months ago, the new API was published to access content on the MATLAB Central community. I shared my MATLAB code to access the API at that time, but the team just released the official SDK.
MATLAB toolbox on File Exchange: https://www.mathworks.com/matlabcentral/fileexchange/135567-matlab-central-interface-for-matlab
Houman and Rameez will talk about how you can model wireless networks (5G, WLAN, Bluetooth, 802.11ax WLAN mesh, etc.) in MATLAB in the upcoming livestream. They will start with the basics such as nodes, links, topology and metrics. Then they will introduce a new free add-on library that lets you model such networks, and show you how to use it.
- Date: Thu, Oct 5, 2023
- Time: 11 am EDT (or your local time)
Bookmark this link:

To solve the puzzle, first unscramble each of the words on the left. Then rearrange the letters in the yellow shaded boxes to complete the sentence on the right.
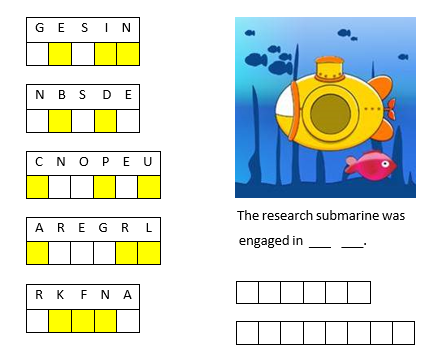
If you enjoyed this puzzle let me know with a like or in the comments below and I'll post more of them. Please don't post your answer, or any hints, and spoil it for those who come across this puzzle after you!! If you want to check your answer, you can messge me your guess through the link on my profile card (click on my name, Rena Berman, above and then on the envelope icon in the top right corner of the profile card that appears).
Congratulations, @Adam Danz for winning the Editor's Pick badge awarded for MATLAB Answers, in recognition of your awesome solution in overlapping images in grid layout.
Thank you for going to great lengths to help a user in this thread by suggesting alternative approach to representing stack of playing cards in MATLAB, highlighting very interesting features like hggroup.
This badge recognizes awesome answers people contribute and yours was picked for providing a very detailed and helpful answer.
Thank you so much for setting a high standard for MATLAB Answers and for your ongoing contribution to the community.
MATLAB Central Team

You had a meteoric rise to in our community since you started answering questions in June 2020.
You provided 3218 answers and 926 votes. You are ranked #23 in the community. Thank you for your contribution to the community and please keep up the good track record!
MATLAB Central Team
Hi All,
I'm attempting to put a set of simbiology global sensitivity analysis plots into my thesis and I'm running into some issues with the GSA plots. Firstly, the figures are very large, it would be quite beneficial to grab a set of the plots and arrange them myself, is there any documentation on how to mess around with the '1x1 Sobol' produced by sbiosobol? Or just GSA plots in general.
The second problem is that the results appear to be relative to the most sensitive parameter in that run. Is it recommended to have a resonably sensitive 'baseline' parameter in each run? I find it difficult to compare plots when a not so sensitive parameter is being recorded as near '1' for the whole run because it's being stacked against a set of very insensitive parameters. I.e. if i have multiple sets of GSAs due to a large model, how can I easily compare results? If I could do some single run through with every parameter that would be the ideal, I imagine, but then the default plot would be half a mile off the bottom of my screen, haha! Perhaps there is a solution to the first question that might help there?
Thank you for your help,
Dan
MATLAB Onramp is a free online tutorial and it has been very popular with new MATLAB users to learn how to use it, and MathWorks have been adding more and more modules. The lastest one just dropped https://matlabacademy.mathworks.com/details/power-systems-simulation-onramp/orps
It shows you the basics of power system simulation by modeling a simple microgrid. You will learn how to simulate and measure three-phase circuits, and how to evaluate algorithms like droop control and maximum power point tracking.
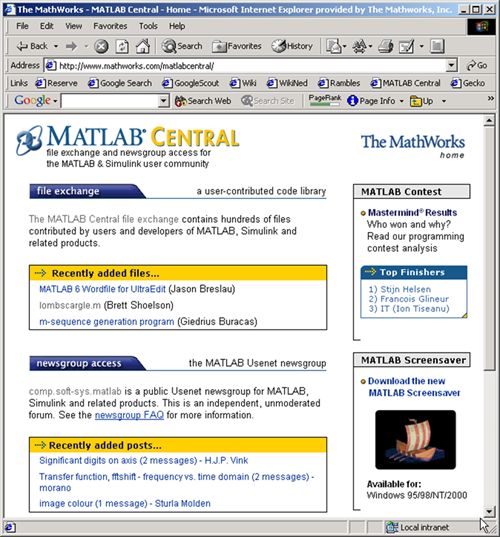
Here's a screenshot from 22 years ago. Thanks for building one of the best engineering and science communities together.
cities
15%
beaches, islands, or cruises
22%
rivers, lakes, or mountains
33%
National Parks or historical sites
14%
wherever my family lives
12%
somewhere else
5%
13709 votos
Hi all,
I've translated a model from another piece of software (monolix) into simbio programmatically to make use of your very easy global sensitivity analysis system.
It looks a little something like this, for a 'single' line example:
r1 = addreaction(model,'InsI -> InsP');
r1.ReactionRate = 'InsI*kip/vi'; %- is + panc
k1 = addkineticlaw(r1, 'Unknown');
Multiplied about 20 fold, as you can see I have included my volumes within the reaction rates myself (vi). The model functions perfectly and I have corrected the outputs at the end:
[time, x, names] = sbiosimulate(model,csObj,dObj1);
x(:,1) = x(:,1)/vi;
So that they are in concentration, as needed. However, when it comes to sensitivity analysis because I have corrected them post-model it is technically incorrect, it is analysing the absolute quantities. This is quite noticible in the sensitivity to the volumes.
Is there an easy fix to this, I've had to fight dimensionality with units in the past using simbio and I'd be great if there was some way of dividing a compartment output by a volume, for example. It is a functionality that exists in monolix, so I was hopeful it might here!
Thank you for your time.
EDIT:
I think I've worked it out, I had to refactor my model to operate in concentrations, just refitting it now. Now I should just be able to use unitless compartments.