Resultados de
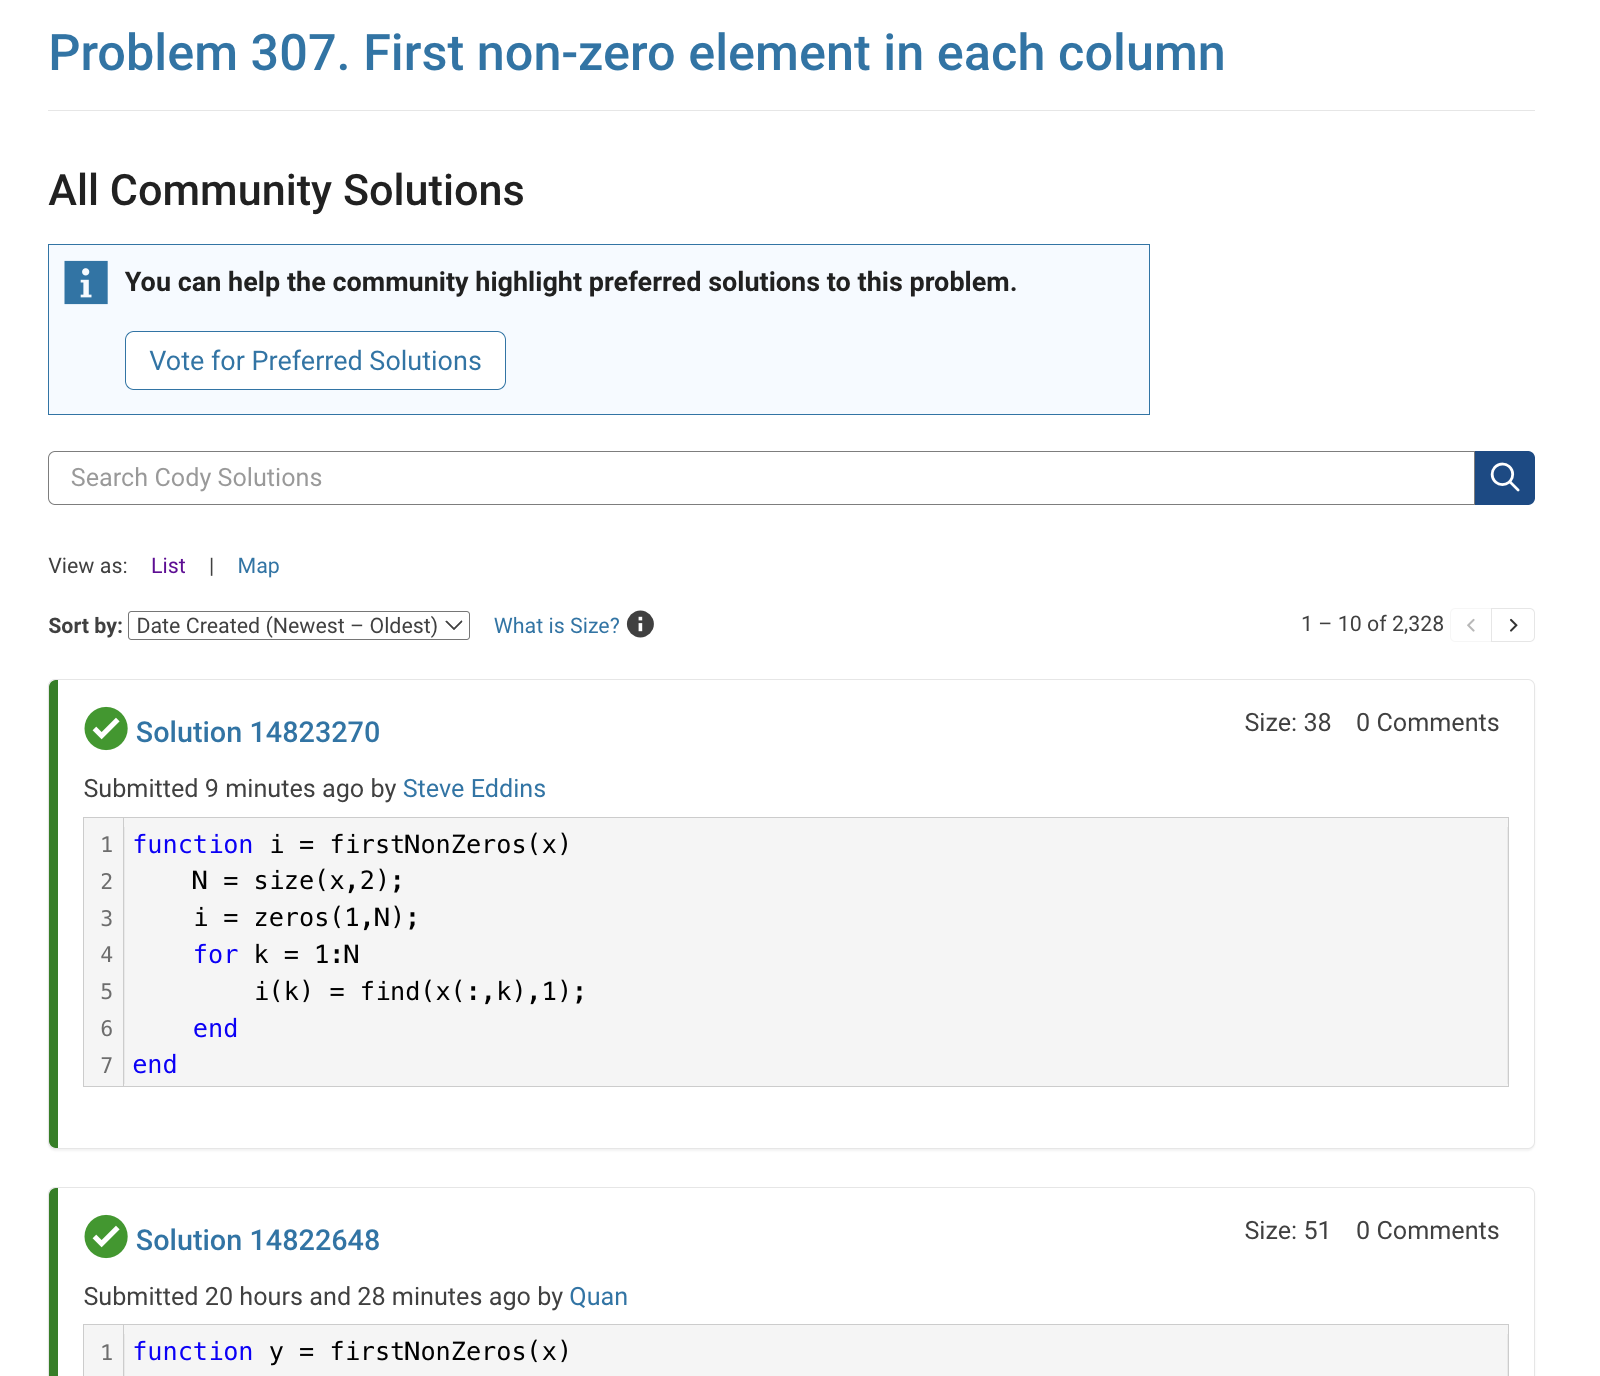
The all-community-solutions view shows the ID of each solution, and you can click on the link to go to the solution.
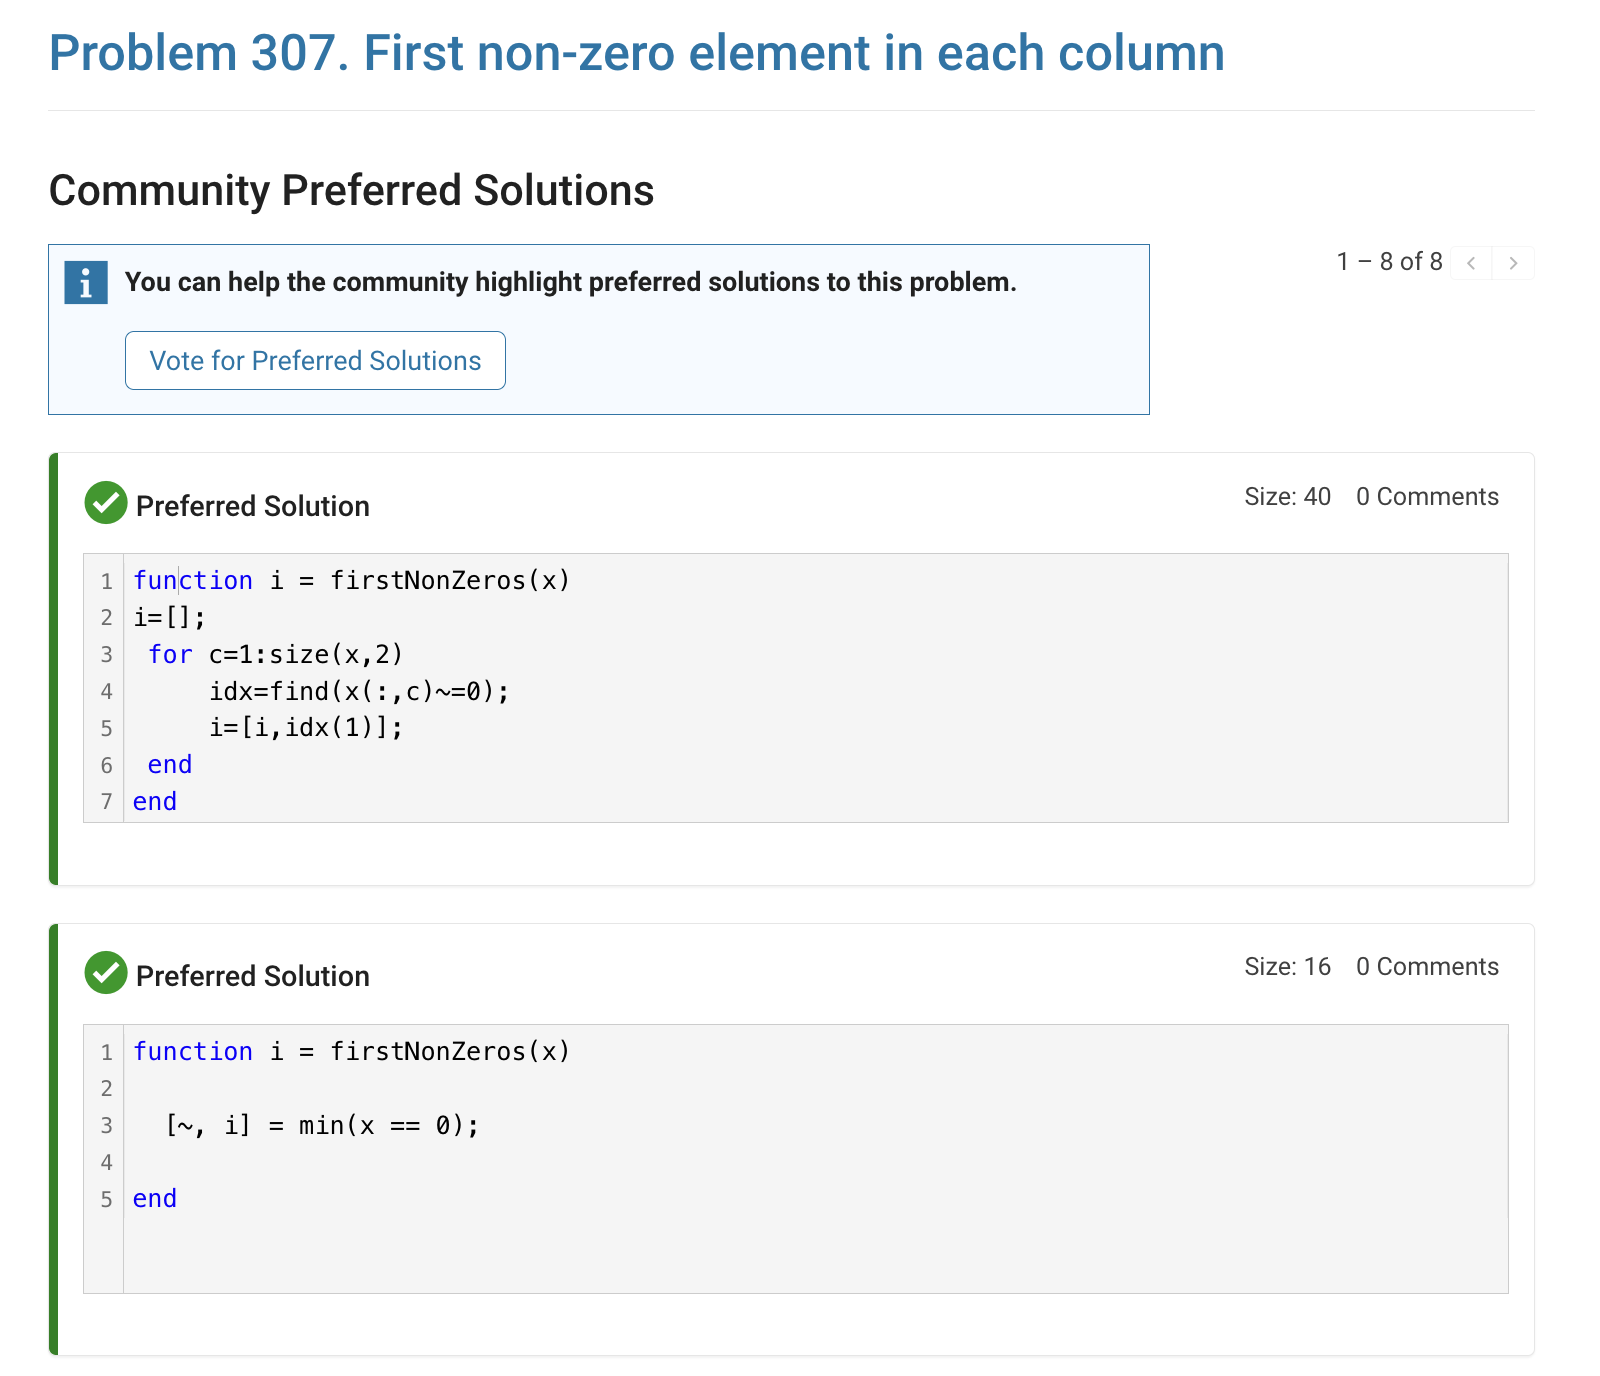
The preferred-community-solutions view does not show the solution IDs and does not link to the solutions. As far as I can tell, there is no way to get from that view to the solutions. If, for example, you want to go to the solution to leave a comment there, you can't.
All-community-solutions view:
Preferred-community-solutions view, with no solution IDs and no links:
Hi cody fellows,
I already solved more than 500 problems -months ago, last july if I remember well- and get this scholar badge, but then it suddenly disappeared a few weeks later. I then solved a few more problems and it reappeared.
Now I observed it disappeared once more a few days ago.
Have you also noticed this erratic behavior of the scholar badge ? Is it normal and / or intentional ? If not, how to explain it ? (deleted problems ?)
Cheers,
Nicolas
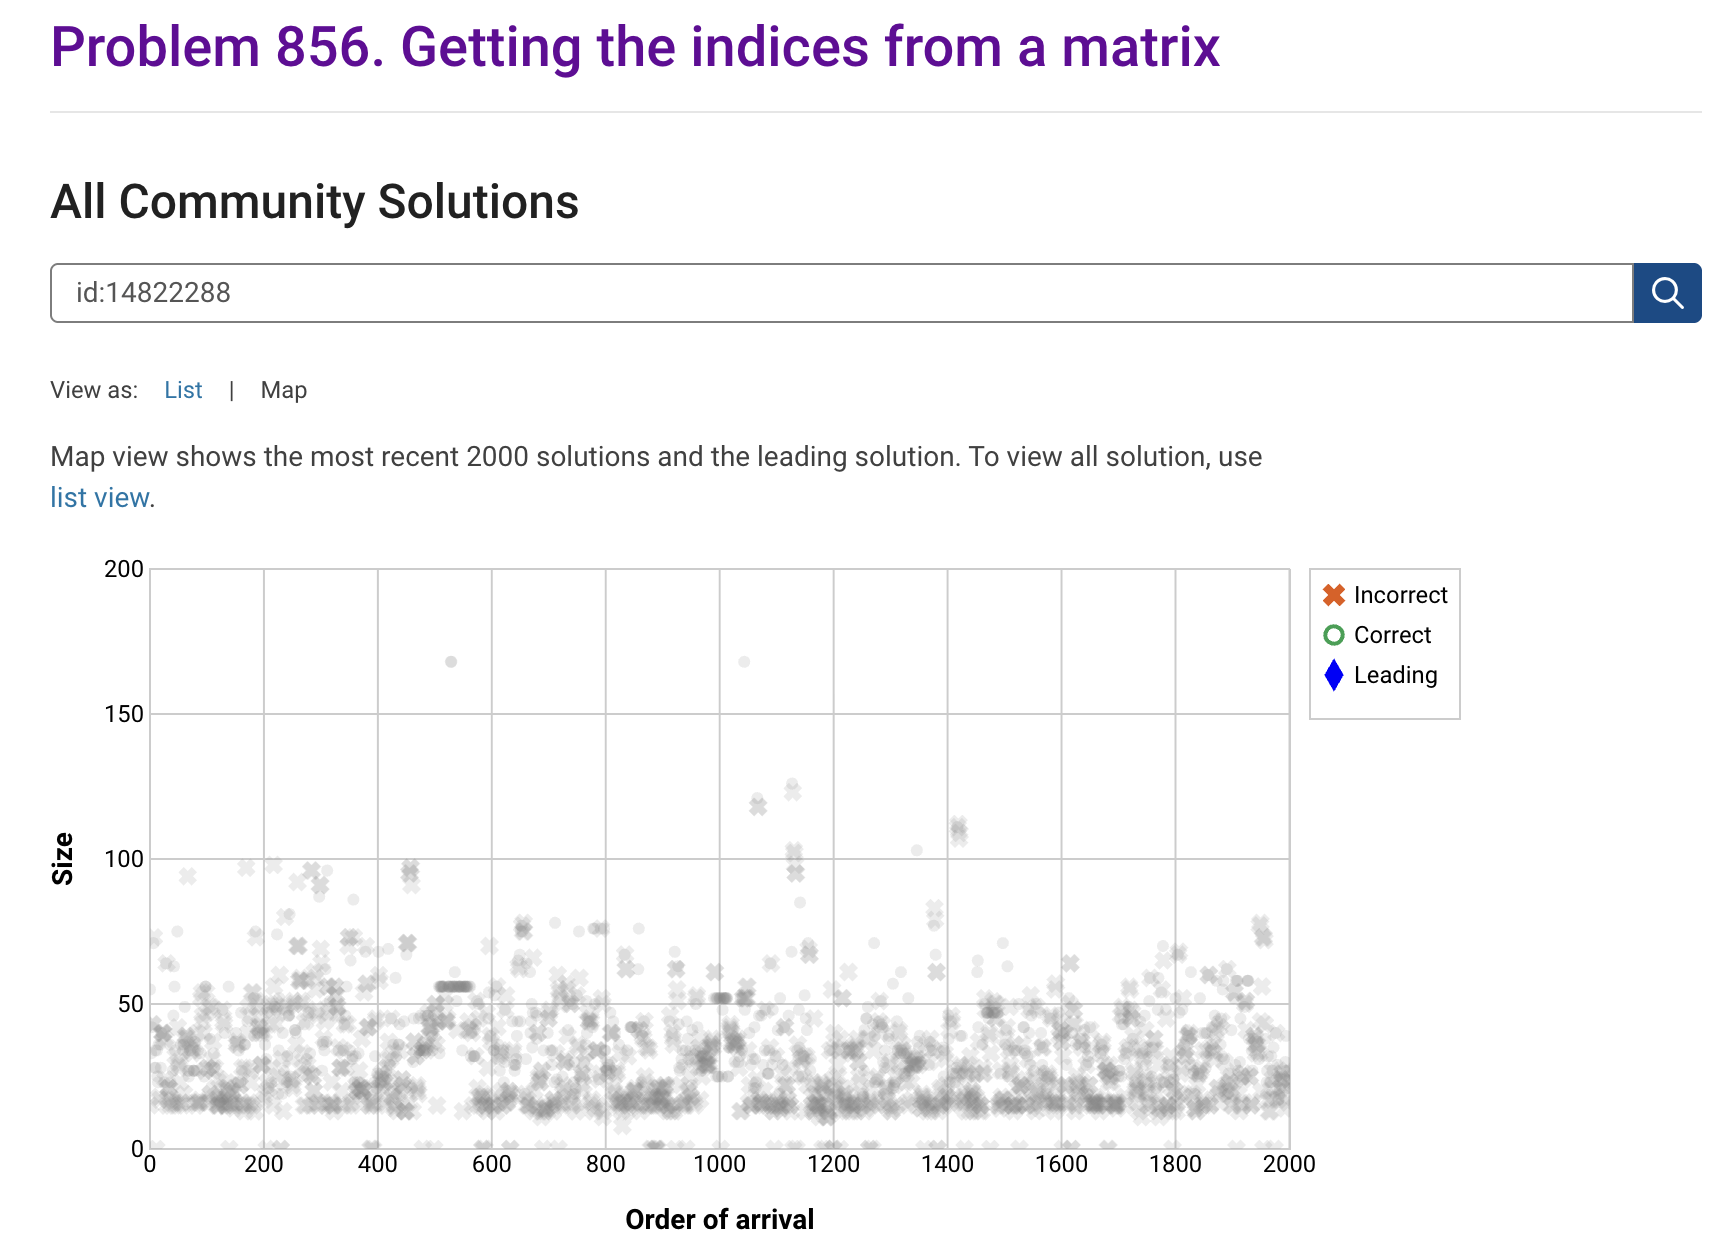
I'm seeing solution maps shown with low-contrast gray colors instead of the correct symbol colors. I have observed this using both Safari and Chrome. Screenshot:
Here is a screenshot of a Cody problem that I just created. The math rendering is poor. (I have since edited the problem to remove the math formatting.)
Are there any code restrictions for programming Cody solutions? I could not find anything mentioned at https://www.mathworks.com/matlabcentral/content/cody/about.html, other than toolbox functions not being available.
For some time now, this has been bugging me - so I thought to gather some more feedback/information/opinions on this.
What would you classify Recursion? As a loop or as a vectorized section of code?
For context, this query occured to me while creating Cody problems involving strict (so to speak) vectorization - (Everyone is more than welcome to check my recent Cody questions).
To make problems interesting and/or difficult, I (and other posters) ban functions and functionalities - such as for loops, while loops, if-else statements, arrayfun() and the rest of the fun() family functions. However, some of the solutions including the reference solution I came up with for my latest problem, contained recursion.
I am rather divided on how to categorize it. What do you think?
作ったコードは公開して使ってもらいましょう!ということでその方法をブログで紹介します。
GitHub や File Exchange で公開しているコードがあれば、ぜひこのスレで教えてください!
ブログで紹介している大まかな3ステップをここにまとめます。
1. GitHub でコードを公開・開発する
- GitHub 上でのリポジトリ公開はコミュニティ形成にもつながります。
- R2025a 以降は MATLAB の Markdown サポートも強化されており、README.md を充実させると理解や導入が促進されます。
2. File Exchange に展開(GitHub と連携して自動同期)
- File Exchangeで公開することで MATLAB 内から検索・インストールが可能になります。
- GitHub と File Exchange の連携設定により、GitHub の更新を自動的に File Exchange に反映させることも可能です。
3. 「Open in MATLAB Online」ボタンやリンクを追加
- GitHub リポジトリに「Open in MATLAB Online」リンクやボタンを埋め込むことで、ブラウザ上でコードを試せます。
Hey cody fellows :-) !
I recently created two problem groups, but as you can see I struggle to set their cover images :
What is weird given :
- I already did it successfully twice in the past for my previous groups ;
- If you take one problem specifically, Problem 60984. Mesh the icosahedron for instance, you can normally see the icon of the cover image in the top right hand corner, can't you ?
- I always manage to set cover images to my contributions (mostly in the filexchange).
I already tried several image formats, included .png 4/3 ratio, but still the cover images don't set.
Could you please help me to correctly set my cover images ?
Thank you.
Nicolas
群馬産業技術センター様をお招きし、製造現場での異常検知の取り組みについてご紹介いただくオンラインセミナーを開催します。
実際の開発事例を通して、MATLABを使った「教師なし」異常検知の進め方や、予知保全に役立つ最新機能もご紹介します。
✅ 異常検知・予知保全に興味がある方
✅ データ活用を何から始めればいいか迷っている方
✅ 実際の現場事例を知りたい方
ぜひお気軽にご参加ください!
Hi everyone,
Please check out our new book "Generative AI for Trading and Asset Management".
GenAI is usually associated with large language models (LLMs) like ChatGPT, or with image generation tools like MidJourney, essentially, machines that can learn from text or images and generate text or images. But in reality, these models can learn from many different types of data. In particular, they can learn from time series of asset returns, which is perhaps the most relevant for asset managers.
In our book (amazon.com link), we explore both the practical applications and the fundamental principles of GenAI, with a special focus on how these technologies apply to trading and asset management.
The book is divided into two broad parts:
Part 1 is written by Ernie Chan, noted author of Quantitative Trading, Algorithmic Trading, and Machine Trading. It starts with no-code applications of GenAI for traders and asset managers with little or no coding experience. After that, it takes readers on a whirlwind tour of machine learning techniques commonly used in finance.
Part 2, written by Hamlet, covers the fundamentals and technical details of GenAI, from modeling to efficient inference. This part is for those who want to understand the inner workings of these models and how to adapt them to their own custom data and applications. It’s for anyone who wants to go beyond the high-level use cases, get their hands dirty, and apply, and eventually improve these models in real-world practical applications.
Readers can start with whichever part they want to explore and learn from.
Simulinkモデルを生成AIで自動的に作成できたら便利だと思いませんか?
QiitaのSacredTubesさんは、このアイデアを実験的に試みた記事を公開しています。
その方法は、まず生成AIでVerilogコードを作成し、それをSimulinkに取り込んでモデル化するというものです。(ここではHDL Coderというツールボックスの機能が使われました:importhdl)
まだ実用段階には至っていませんが、モデルベース開発(MBD)と生成AIの可能性を探る上で、非常に興味深い試みです。
生成AIの限界と可能性を考えるきっかけとして、一読の価値があります。
---
もし「Simulink Copilot」のような生成AIツールが登場するとしたら、
どんな機能があったら嬉しいと思いますか?
- 自然言語でブロック図を生成?
- 既存モデルの自動ドキュメント化?
- シミュレーション結果の要約と解釈?
皆さんのアイデアをぜひシェアしてください!
- 昨日までちゃんと動いていたのに・・
- ヘルプページ通りに書いているのに・・
MATLAB 関数がエラーを出すようになることありますよね(?)そんな時にみなさんがまず確認するもの、何かありますか?教えてください!
例えば
which -all plot
をコマンドウィンドウで実行して、もともと MATLAB で定義されている plot 関数(MATLAB のインストールフォルダにある plot 関数)がちゃんと頭に出てくるかどうか確認します。
I am deeply honored to announce the official publication of my latest academic volume:
MATLAB for Civil Engineers: From Basics to Advanced Applications
(Springer Nature, 2025).
This work serves as a comprehensive bridge between theoretical civil engineering principles and their practical implementation through MATLAB—a platform essential to the future of computational design, simulation, and optimization in our field.
Structured to serve both academic audiences and practicing engineers, this book progresses from foundational MATLAB programming concepts to highly specialized applications in structural analysis, geotechnical engineering, hydraulic modeling, and finite element methods. Whether you are a student building analytical fluency or a professional seeking computational precision, this volume offers an indispensable resource for mastering MATLAB's full potential in civil engineering contexts.
With rigorously structured examples, case studies, and research-aligned methods, MATLAB for Civil Engineers reflects the convergence of engineering logic with algorithmic innovation—equipping readers to address contemporary challenges with clarity, accuracy, and foresight.
📖 Ideal for:
— Graduate and postgraduate civil engineering students
— University instructors and lecturers seeking a structured teaching companion
— Professionals aiming to integrate MATLAB into complex real-world projects
If you are passionate about engineering resilience, data-informed design, or computational modeling, I invite you to explore the work and share it with your network.
🧠 Let us advance the discipline together through precision, programming, and purpose.
キーと値の組み合わせでデータを格納できるディクショナリ。R2022bでdictionaryコマンドが登場し、最近のバージョンではreaddictionaryとwritedictionaryでJSONファイルからの読み込み・書き込みにも対応しました。
私はMIDIデータからピアノの演奏動画を作るプログラムで、ディクショナリを使いました。音のノート番号をキーにして、patchで白と黒で鍵盤を塗りつぶしたmatlab.graphics.Graphicsデータ型を値にしたディクショナリで保存して、MIDIで鳴らされた音のノート番号からlookupでグラフのオブジェクトを取得し、FaceColorを変更してハイライトするというもの。
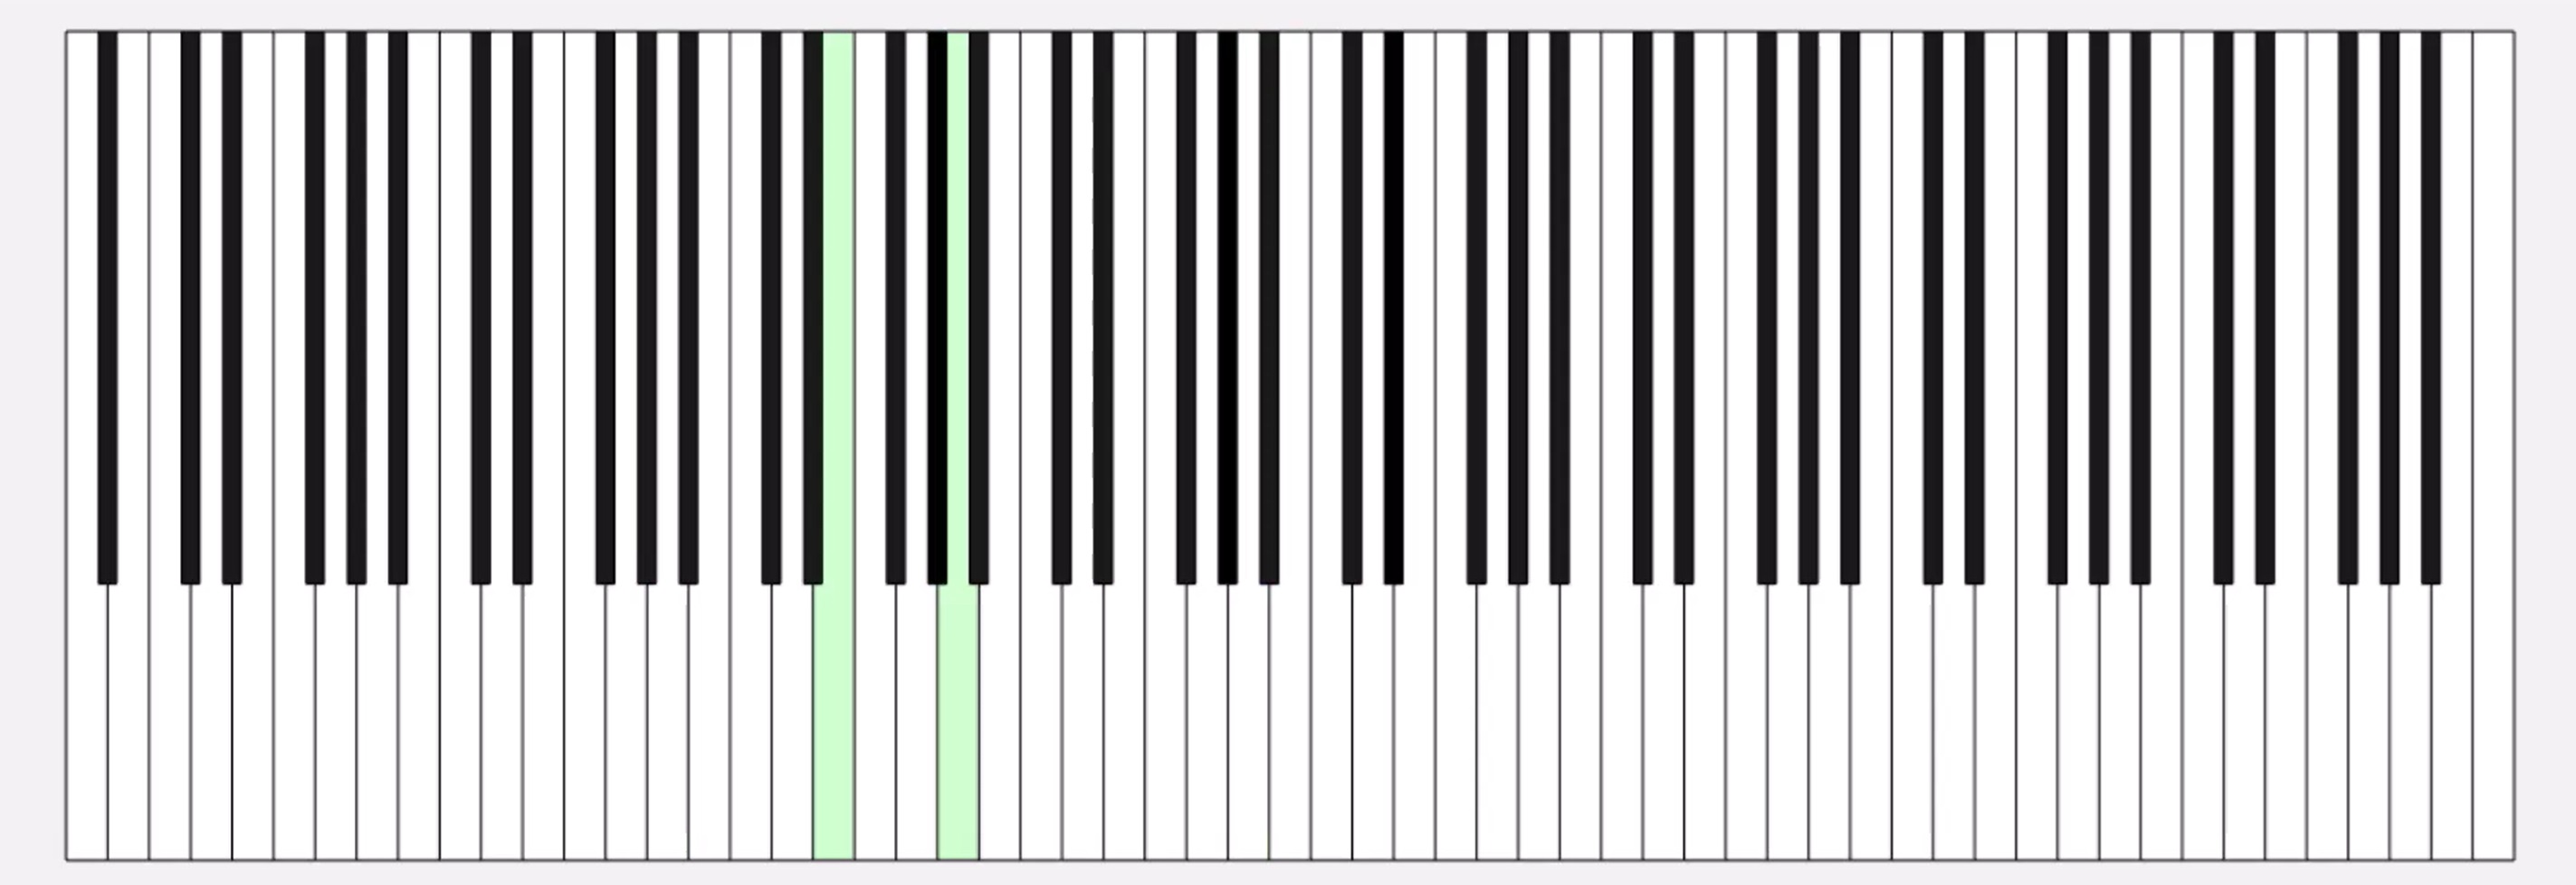
コード例
%% MIDIデータの.matファイルを読み取ってピアノを描画するサンプル
fig = figure('Position', [34 328 1626 524]);
ax = axes;
whiteKeyY = [0 0 150 150];
whiteKeyColor = [1 1 1];
blackKeyY = [50 50 150 150];
blackKeyColor = [0.1 0.1 0.1];
edgeColor = [0 0 0];
% ディクショナリの定義
d = configureDictionary("double", "matlab.graphics.Graphics");
% 白鍵を描画
for n = 1:9
pos = 23*7*(n-1);
d = insert(d, 21 + (n-1)*12, patch([pos+5 pos+28 pos+28 pos+5],whiteKeyY, whiteKeyColor, 'EdgeColor', edgeColor, 'UserData', 21 + (n-1)*12));
d = insert(d, 23 + (n-1)*12, patch([pos+28 pos+51 pos+51 pos+28], whiteKeyY, whiteKeyColor, 'EdgeColor', edgeColor, 'UserData', 23 + (n-1)*12));
d = insert(d, 24 + (n-1)*12, patch([pos+51 pos+74 pos+74 pos+51], whiteKeyY, whiteKeyColor, 'EdgeColor', edgeColor, 'UserData', 24 + (n-1)*12));
if n < 9
d = insert(d, 26 + (n-1)*12, patch([pos+74 pos+97 pos+97 pos+74], whiteKeyY, whiteKeyColor, 'EdgeColor', edgeColor, 'UserData', 26 + (n-1)*12));
d = insert(d, 28 + (n-1)*12, patch([pos+97 pos+120 pos+120 pos+97], whiteKeyY, whiteKeyColor, 'EdgeColor', edgeColor, 'UserData', 28 + (n-1)*12));
d = insert(d, 29 + (n-1)*12, patch([pos+120 pos+143 pos+143 pos+120], whiteKeyY, whiteKeyColor, 'EdgeColor', edgeColor, 'UserData', 29 + (n-1)*12));
d = insert(d, 31 + (n-1)*12, patch([pos+143 pos+166 pos+166 pos+143], whiteKeyY, whiteKeyColor, 'EdgeColor', edgeColor, 'UserData', 31 + (n-1)*12));
end
end
% 黒鍵を描画。白鍵の上になるようにループを分けています
for n = 1:9
pos = 23*7*(n-1);
d = insert(d, 22 + (n-1)*12, patch([pos+23 pos+33 pos+33 pos+23], blackKeyY, blackKeyColor, 'EdgeColor', [0 0 0], 'UserData', 22 + (n-1)*12));
if n < 9
d = insert(d, 25 + (n-1)*12, patch([pos+69 pos+79 pos+79 pos+69], blackKeyY, blackKeyColor, 'EdgeColor', [0 0 0], 'UserData', 25 + (n-1)*12));
d = insert(d, 27 + (n-1)*12, patch([pos+92 pos+102 pos+102 pos+92], blackKeyY, blackKeyColor, 'EdgeColor', [0 0 0], 'UserData', 27 + (n-1)*12));
d = insert(d, 30 + (n-1)*12, patch([pos+138 pos+148 pos+148 pos+138], blackKeyY, blackKeyColor, 'EdgeColor', [0 0 0], 'UserData', 30 + (n-1)*12));
d = insert(d, 32 + (n-1)*12, patch([pos+161 pos+171 pos+171 pos+161], blackKeyY, blackKeyColor, 'EdgeColor', [0 0 0], 'UserData', 32 + (n-1)*12));
end
end
xticklabels({})
yticklabels({})
xlim([5 1362])
drawnow
%% MIDI音源の.matファイルを読み込み
matData = load('fur-elise.mat');
msg = matData.receivedMessages;
eventTimes = [msg.Timestamp] - msg(1).Timestamp;
n = 1;
numNotes = 0;
lastNote = 0;
highlightedCircles = cell(1, 127);
% 音が鳴った鍵盤だけハイライトする
tic
while toc < max(eventTimes)
if toc > eventTimes(n)
thisMsg = msg(n);
if thisMsg.Type == "NoteOn"
numNotes = numNotes + 1;
lastNote = thisMsg.Note;
thisPatch = lookup(d, thisMsg.Note);
thisPatch.FaceColor = '#CCFFCC';
drawnow
elseif thisMsg.Type == "NoteOff"
numNotes = 0;
thisPatch = lookup(d, thisMsg.Note);
[~, ~, wOrB] = calcNotePos(thisMsg.Note);
if wOrB == "w"
thisPatch.FaceColor = 'white';
else
thisPatch.FaceColor = 'black';
end
drawnow
end
n = n+1;
end
end
%% サブ関数
function [pianoPos, centerPos, wOrB] = calcNotePos(note)
tempVar = idivide(int64(note), int64(12)); % 12で割った商
pos = 23*7*(tempVar-1);
switch mod(note, 12)
case 0 % C
pianoPos = pos + 62.5;
centerPos = 30;
wOrB = "w";
case 2 % D
pianoPos = pos + 85.5;
centerPos = 30;
wOrB = "w";
case 4 % E
pianoPos = pos + 108.5;
centerPos = 30;
wOrB = "w";
case 5 % F
pianoPos = pos + 131.5;
centerPos = 30;
wOrB = "w";
case 7 % G
pianoPos = pos + 154.5;
centerPos = 30;
wOrB = "w";
case 9 % A
pianoPos = pos + 177.5;
centerPos = 30;
wOrB = "w";
case 11 % B
pianoPos = pos + 200.5;
centerPos = 30;
wOrB = "w";
case 1 % C#
pianoPos = pos + 69;
centerPos = 100;
wOrB = "b";
case 3 % D#
pianoPos = pos + 92;
centerPos = 100;
wOrB = "b";
case 6 % F#
pianoPos = pos + 138;
centerPos = 100;
wOrB = "b";
case 8 % G#
pianoPos = pos + 161;
centerPos = 100;
wOrB = "b";
case 10 % A#
pianoPos = pos + 184;
centerPos = 100;
wOrB = "b";
end
end
皆さんはディクショナリを使ってますか? もし使っていたら、どういう活用をしているか、聞かせてください!
どの方法を使う事が多いですか?他によく使う方法があれば教えてくださいー。
方法①
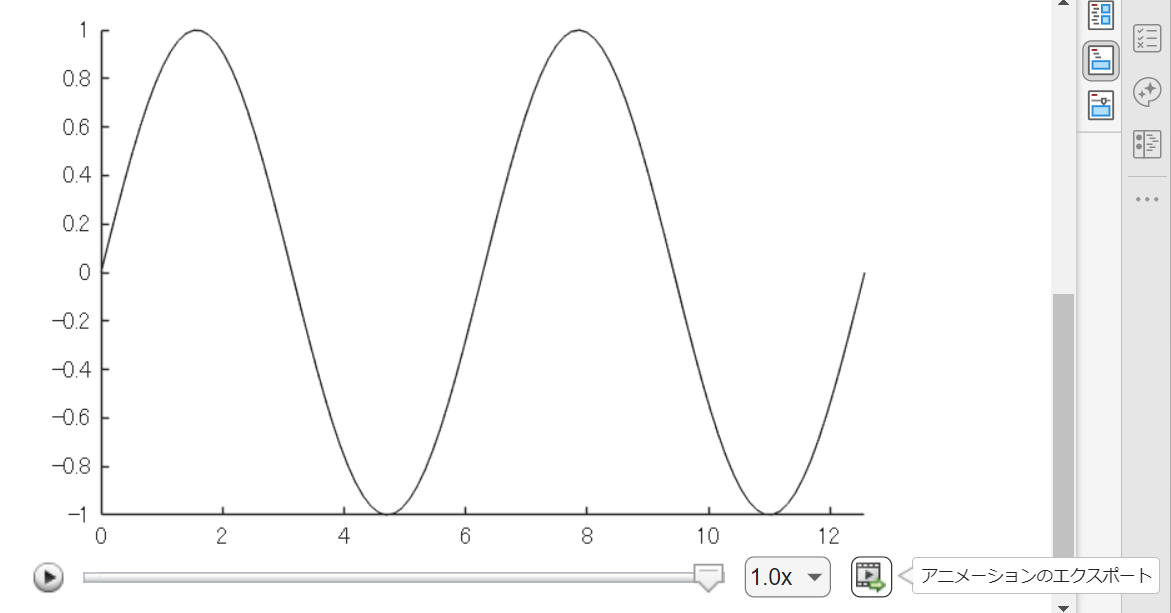
Livescript 上で for ループ内で描画を編集させて描いた動画は「アニメーションのエクスポート」から動画ファイルに出力するのが一番簡単ですね。再生速度やら細かい設定ができない点は要注意。
方法②
exportgraphics 関数で "Append" オプション指定で実現できるようになった(R2022a から)のでこれも便利ですね。
N = 100;
x = linspace(0,4*pi,N);
y = sin(x);
filename = 'animation_sample.gif'; % Specify the output file name
if exist(filename,'file')
delete(filename)
end
h = animatedline;
axis([0,4*pi,-1,1]) % x軸の表示範囲を固定
for k = 1:length(x)
addpoints(h,x(k),y(k)); % ループでデータを追加
exportgraphics(gca,filename,"Append",true)
end
方法③
R2021b 以前のバージョンだとこんな感じ。
各ループで画面キャプチャして、imwrite で動画ファイルにフレーム追加していくイメージです。"DelayTime" を使って細かい指定ができるので、必要に応じて今でも利用します。
for k = 1:length(x)
addpoints(h,x(k),y(k)); % ループでデータを追加
drawnow % グラフアップデート
frame = getframe(gcf); % Figure 画面をムービーフレーム(構造体)としてキャプチャ
tmp = frame2im(frame); % 画像に変更
[A,map] = rgb2ind(tmp,256); % RGB -> インデックス画像に
if k == 1 % 新規 gif ファイル作成
imwrite(A,map,filename,'gif','LoopCount',Inf,'DelayTime',0.2);
else % 以降、画像をアペンド
imwrite(A,map,filename,'gif','WriteMode','append','DelayTime',0.2);
end
end
これからは生成AIでコードを1から書くという事が減ってくるのかと思いますが,皆さんがMATLABのコードを書く時に意識しているご自身のルールのようなものがあれば教えてください.
MATLAB言語は柔軟に書けますが,自然と個人個人のルールというものが出来上がってきているのでは,と思います.
私はParameter, Valueペアの引数がある関数はそれぞれのペアを新しい行に書く,というのをよくやります.
h = plot(x, y, "ro-", ...
"LineWidth", 2, ...
"MarkerSize", 10, ...
"MarkerFaceColor", "g");
Parameter=Valueでも同じです.
h = plot(x, y, "ro-", ...
LineWidth = 2, ...
MarkerSize = 10, ...
MarkerFaceColor = "g");
また,一時期は "=" を揃えることもやってました(今はやってませんが).
h = plot(x, y, "ro-", ...
LineWidth = 2, ...
MarkerSize = 10, ...
MarkerFaceColor = "g");
皆さんにはどのようなルールがありますか?
The Graphics and App Building Blog just launched its first article on R2025a features, authored by Chris Portal, the director of engineering for the MATLAB graphics and app building teams.
Over the next few months, we'll publish a series of articles that showcase our updated graphics system, introduce new tools and features, and provide valuable references enriched by the perspectives of those involved in their development.
To stay updated, you can subscribe to the blog (look for the option in the upper left corner of the blog page). We also encourage you to join the conversation—your comments and questions under each article help shape the discussion and guide future content.
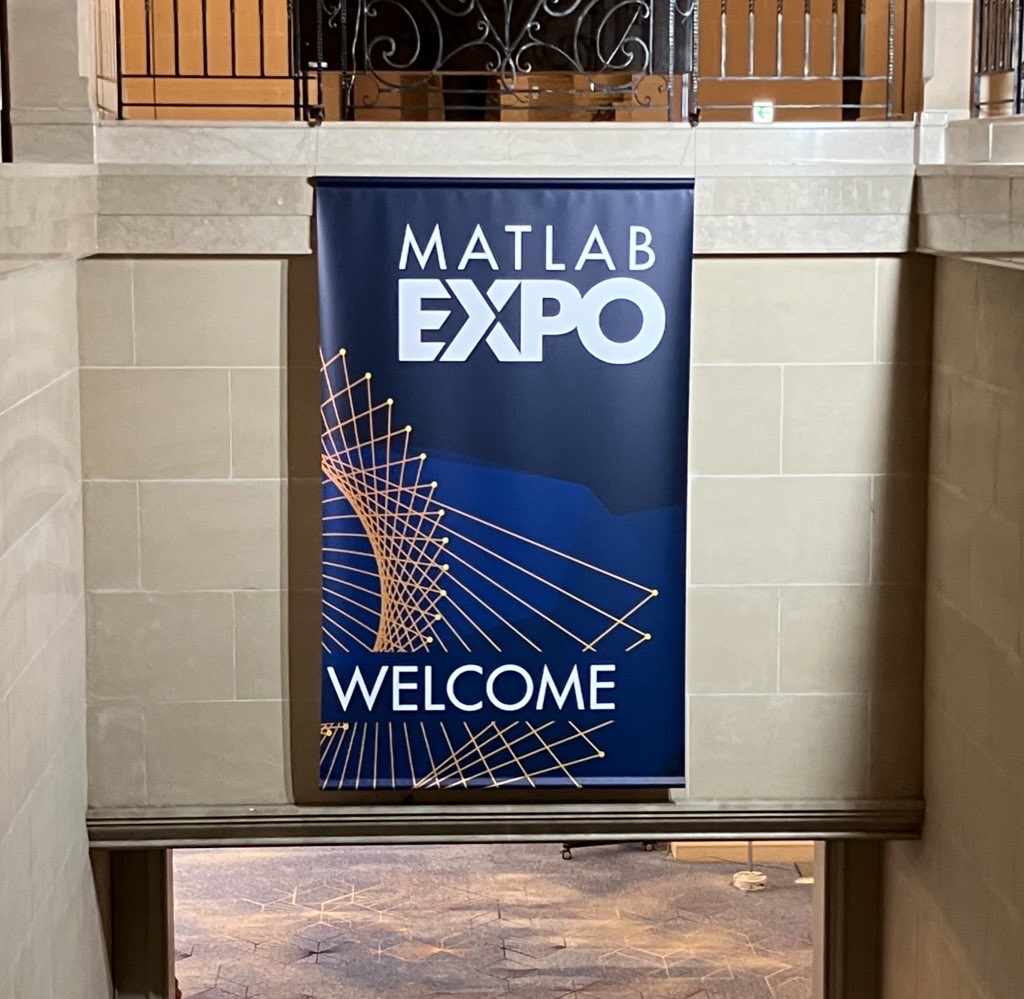
昨日 5/29 にお台場で MATLAB EXPO が開催されました。ご参加くださった方々ありがとうございました!
私は AI 関連のデモ展示で解説員としても立っておりましたが、立ち寄ってくださる方が絶えず、ずっと喋り続けてました。また、講演後に「さっきのすごくね?」という会話が漏れ聞こえてきたのがハイライト。
参加されたみなさま、印象に残ったこと・気になった講演・ポスター・デモ・新機能等あったら教えてください!(次回に向けて運営面での感想も)