maboxplot
Create box plot for microarray data
Syntax
maboxplot(MAData)

maboxplot(MAData, ColumnName)

maboxplot(MAStruct, FieldName)

H = maboxplot(...)

[H, HLines]
= maboxplot(...)


maboxplot(..., 'Title', TitleValue,
...)

maboxplot(..., 'Notch', NotchValue,
...)

maboxplot(..., 'Symbol', SymbolValue,
...)

maboxplot(..., 'Orientation', OrientationValue,
...)

maboxplot(..., 'WhiskerLength', WhiskerLengthValue,
...)

maboxplot(..., 'BoxPlot', BoxPlotValue,
...)
Arguments
MAData | DataMatrix object, numeric array,
or a structure containing a field called Data.
The values in the columns of MAData will
be used to create box plots. If a DataMatrix object, the column names
are used as labels in the box plot. |
ColumnName | An array of column names corresponding
to the data in MAData used as labels in
the box plot. |
MAStruct | A microarray data structure. |
FieldName | A field within the microarray data structure, MAStruct.
The values in the field FieldName will
be used to create box plots. |
TitleValue | Character vector or string to use as the title for the plot. The
default title is FieldName. |
NotchValue | Logical specifying the type of boxes drawn. Choices are:
false. |
OrientationValue | Character vector or string specifying the orientation of the box plot. Choices are:
|
WhiskerLengthValue | Value specifying the maximum length of
the whiskers as a function of the interquartile range (IQR). The whisker
extends to the most extreme data value within 1.5. If WhiskerLengthValue equals 0,
then maboxplot displays all data values outside
the box, using the plotting symbol Symbol. |
BoxPlotValue | A cell array of property name/property
value pairs to pass to the Statistics and Machine Learning Toolbox™ |
Description
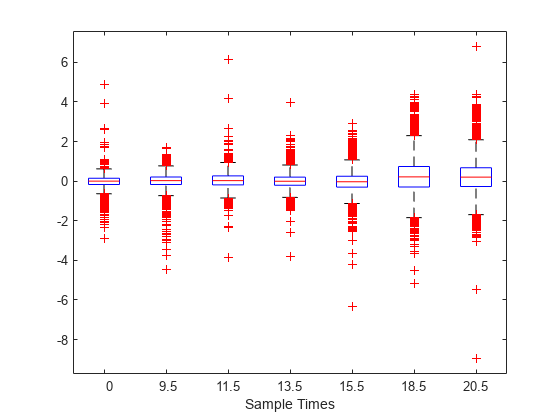
maboxplot( displays
a box plot of the values in the columns of MAData)MAData. MAData can
be a DataMatrix
object, numeric array, or a structure containing a field called Data,
containing microarray data.
maboxplot( labels
the box plot column names.MAData, ColumnName)
maboxplot( displays
a box plot of the values in the field MAStruct, FieldName)FieldName in
the microarray data structure MAStruct.
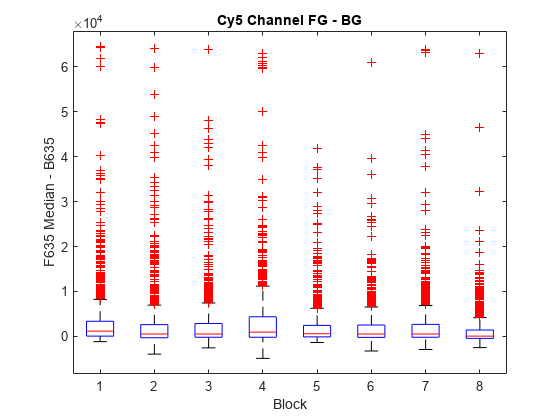
If MAStruct is block based, maboxplot creates
a box plot of the values in the field FieldName for
each block.
Note
If you provide MAStruct, without
providing FieldName, maboxplot uses
the Signal element in the ColumnNames field
of MAStruct, if Affymetrix®data, or
the first element in the ColumnNames field of MAStruct,
otherwise.
H = maboxplot(...)
[ returns the handles of the lines used
to separate the different blocks in the image. H, HLines]
= maboxplot(...)
maboxplot(..., ' calls PropertyName', PropertyValue,
...)maboxplot with optional properties
that use property name/property value pairs. You can specify one or
more properties in any order. Each PropertyName must
be enclosed in single quotation marks and is case insensitive. These
property name/property value pairs are as follows:
maboxplot(..., 'Title', allows you to specify the title of the plot. The default TitleValue,
...)TitleValue is FieldName.
maboxplot(..., 'Notch', if NotchValue,
...)NotchValue is true,
draws notched boxes. The default is false to show
square boxes.
maboxplot(..., 'Symbol', allows you to specify the symbol used for outlier
values. The default SymbolValue,
...)Symbol is '+'.
maboxplot(..., 'Orientation', allows you to specify the orientation of the box plot.
The choices are OrientationValue,
...)'Vertical' and 'Horizontal'.
The default is 'Vertical'.
maboxplot(..., 'WhiskerLength', allows you to specify the whisker length for the box
plot. WhiskerLengthValue,
...)WhiskerLengthValue defines the maximum
length of the whiskers as a function of the interquartile range (IQR)
(default = 1.5). The whisker extends to the most
extreme data value within WhiskerLength*IQR of
the box. If WhiskerLengthValue equals 0,
then maboxplot displays all data values outside
the box, using the plotting symbol Symbol.
maboxplot(..., 'BoxPlot', allows you to specify arguments to pass to the BoxPlotValue,
...)boxplot function,
which creates the box plot. BoxPlotValue is
a cell array of property name/property value pairs. For valid pairs,
see the boxplot function.
Examples
Version History
Introduced before R2006a
See Also
magetfield | maimage | mairplot | maloglog | malowess | manorm | mavolcanoplot | boxplot

