plotWeights
Class: Autoencoder
(To be removed) Plot a visualization of the weights for the encoder of an autoencoder
plotWeights will be removed in a future release. For more information,
see Transition Legacy Neural Network Code to dlnetwork Workflows.
For advice on updating your code, see Version History.
Description
Input Arguments
Output Arguments
Examples
Load the training data.
X = digitTrainCellArrayData;
The training data is a 1-by-5000 cell array, where each cell contains a 28-by-28 matrix representing a synthetic image of a handwritten digit.
Train an autoencoder with a hidden layer of 25 neurons.
hiddenSize = 25;
autoenc = trainAutoencoder(X,hiddenSize, ...
  'L2WeightRegularization',0.004, ...
  'SparsityRegularization',4, ...
  'SparsityProportion',0.2);
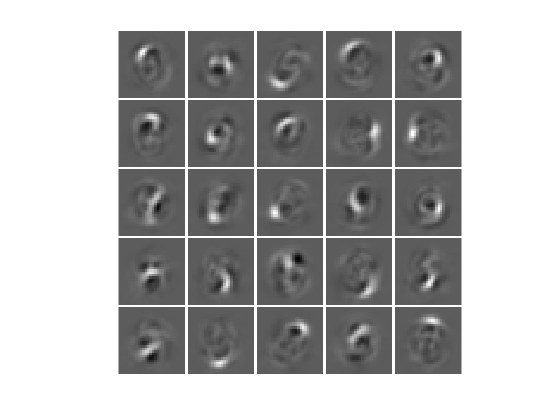
Visualize the learned features.
plotWeights(autoenc);
Tips
plotWeightsallows the visualization of the features that the autoencoder learns. Use it when the autoencoder is trained on image data. The visualization of the weights has the same dimensions as the images used for training.
Version History
Introduced in R2015bSee Also
Time Series
Modeler | fitrnet (Statistics and Machine Learning Toolbox) | fitcnet (Statistics and Machine Learning Toolbox) | trainnet | trainingOptions | dlnetwork