hide
Make geoplayer figure invisible
Syntax
Description
Examples
Load a sequence of latitude and longitude coordinates.
data = load("geoRoute.mat");Create a geographic player with a zoom level of 10. Configure the player to show its complete history of plotted points.
player = geoplayer(data.latitude(1),data.longitude(1),10,HistoryDepth=Inf);
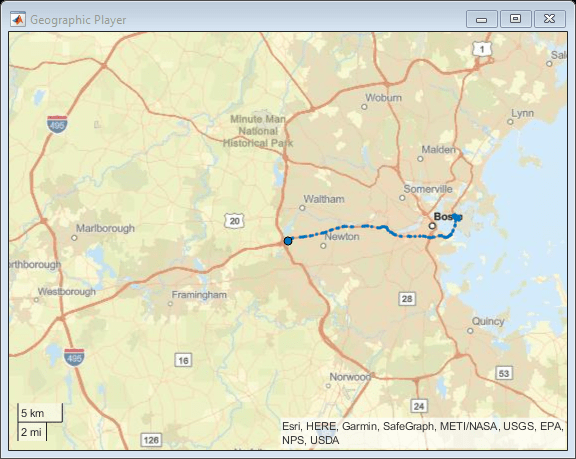
Display the first half of the geographic coordinates in a sequence. The circle marker indicates the current position.
halfLength = round(length(data.latitude)/2);

for i = 1:halfLength
    plotPosition(player,data.latitude(i),data.longitude(i));
end
Hide the player and confirm that it is no longer visible.
hide(player)
isOpen(player)
ans = logical
   0
Add the remaining half of the geographic coordinates to the map.
for i = halfLength+1:length(data.latitude)
    plotPosition(player,data.latitude(i),data.longitude(i));
end
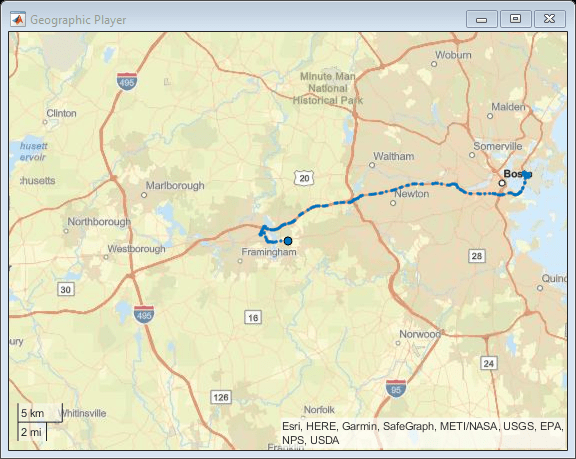
Show the player. The player now displays both halves of the route.
show(player)
Input Arguments
Version History
Introduced in R2018a
1 Alignment of boundaries and region labels are a presentation of the feature provided by the data vendors and do not imply endorsement by MathWorks®.