zplane
Z-plane zero-pole plot for discrete-time filter System object
Description
zplane(
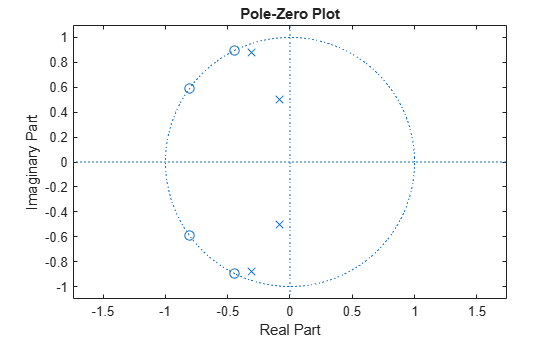
plots the zeros and poles of the filter System object™, sysobj)sysobj, with the unit circle
for reference. Each zero is represented with an
'o' and each pole with a
'x' on the plot. Multiple zeros
and poles are indicated by the multiplicity number shown at
the upper right of the zero or pole.
When you run the filter System object with a fixed-point input, the filter becomes a
quantized fixed-point filter, filtQuant.
When filtQuant is a quantized filter,
zplane(filtQuant) plots the
poles and zeros of the quantized and unquantized filters.
The symbols ![]() and
and + represent the
zeros and poles of the quantized filter
filtQuant. The plot includes the
unit circle for reference.
Examples
Create a fourth-order IIR digital filter with a cutoff frequency of 0.6. Plot the poles and zeros of this filter.
[b,a] = ellip(4,.5,20,.6);
zplane(b,a)
Quantize the filter by passing a fixed-point input through the filter algorithm. Plot the quantized and unquantized poles and zeros associated with this filter.
iirFilt = dsp.IIRFilter(Numerator=b,Denominator=a);
in = fi(randn(15,6),1,15,3);
out = iirFilt(in);
zplane(iirFilt)
