schedule
Visualize task scheduling
Description
schedule(, using the
Simulation Data Inspector, helps you to visualize how code was executed on the target
hardware in the last software-in-the-loop (SIL), processor-in-the-loop (PIL), or XCP-based
external mode simulation.executionProfile)
schedule(
uses name-value arguments to control the display of function execution and simulation
time.executionProfile,Name,Value)
Examples
This example uses a SIL simulation to show how you can visualize task scheduling. For an example that uses an XCP external mode simulation, see Visualize Task Scheduling in XCP External Mode Simulation.
Run a SIL simulation with a model that is configured to generate a workspace variable with execution-time measurements.
openExample('ecoder/SILPILVerificationExample', ...
             supportingFile='SILTopModel.slx')

% Disable Simulink Code Coverage and third-party code coverage analysis
set_param('SILTopModel',...
          'CovEnable', 'off');
covSettings = get_param('SILTopModel', 'CodeCoverageSettings');
covSettings.CoverageTool = 'None';
set_param('SILTopModel', 'CodeCoverageSettings', covSettings);

% Configure code execution time profiling
set_param('SILTopModel',...
          'CodeExecutionProfiling', 'on');
set_param('SILTopModel',...
          'CodeProfilingInstrumentation', 'Detailed');
set_param('SILTopModel',...
          'CodeProfilingSaveOptions', 'AllData');
simOut = sim('SILTopModel');
The simulation generates the variable executionProfile (default)
in the object simOut.
At the end of the SIL simulation, open the Code Profile Analyzer:
Click the SIL/PIL tab.
In the Results gallery, under Execution Profiling Results, click Code Profile Analyser.
In the Analysis section, click Function
Execution. You see execution-time metrics for six code sections, for
example, the step [0.1 0] task and the
CounterTypeA and CounterTypeB functions.

To visualize how the tasks are scheduled and generated code is executed, in the Results section, click Generate Schedule. Or, in the Command Window, enter:
schedule(simOut.executionProfile)
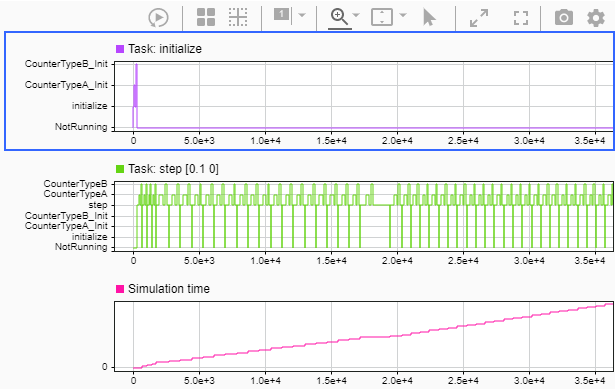
The Simulation Data Inspector displays task and simulation time plots.
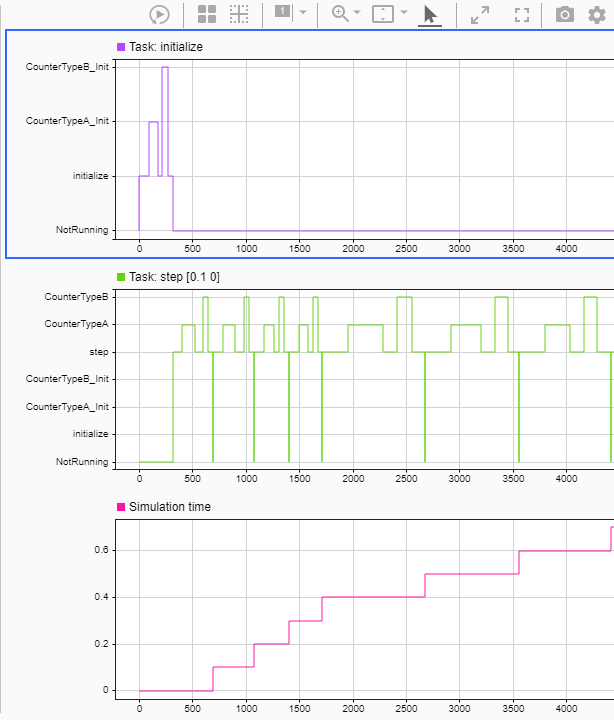
In each task plot, the Y-axis lists tasks and functions executed. From the plots, you can infer the following information:
The order in which tasks run.
If the model is multi-rate, you can see how Simulink® schedules the different rates (a task for each rate).
The time that is required to execute a task or a function, computed as the difference between the stop and start times. For example, observe that
CounterTypeBtakes less time to run thanCounterTypeA. When a task is not running, the Y-axis value of the plot isNotRunning.The order in which functions run within a task. For example, in the initialize task,
counterTypeA_Initfunction runs beforecounterTypeB_Initfunction. If function calls are nested, you can see the execution order of the functions.
The last plot shows the simulation time when the tasks and functions are executed.
Input Arguments
Name-Value Arguments
Version History
Introduced in R2021a