Contenido principal

renderChart

R2026b

Render test chart in optical system

Since R2026b

Description

Add-On Required: This feature requires the Optical Design and Simulation Library for Image Processing Toolbox add-on.

chart = renderChart(opsys) renders a 24-color ColorChecker test chart through the image sensor of the optical system opsys.

example

chart = renderChart(opsys,chartType) renders the specified chart type in the optical system.

chart = renderChart(opsys,___,Name=Value) specifies options for rendering the chart using one or more name-value arguments in addition to any combination of input arguments from previous syntaxes. For example, Distance=500 specifies the distance from the optical system origin to the chart center as 500 millimeters.

Examples

collapse all

Create an optical system that contains a double Gauss lens using the createDoubleGauss helper function. The function is attached to this example as a supporting file.

opsys = createDoubleGauss;

Add an image sensor to the optical system, and focus the optical system.

addImageSensor(opsys)
focus(opsys)

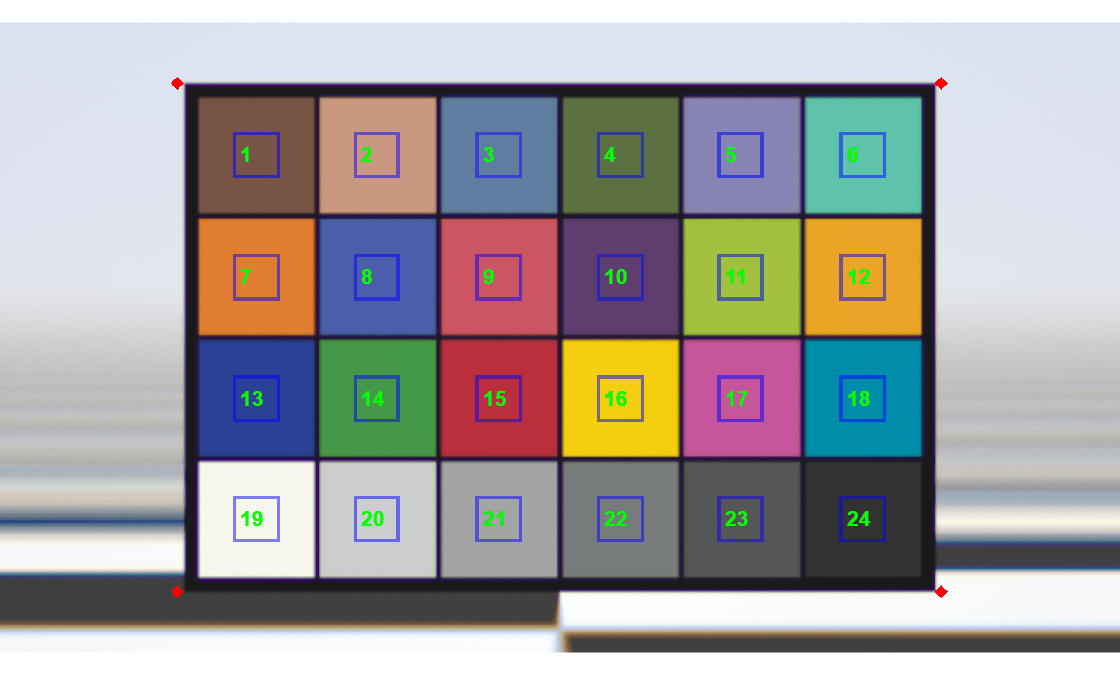
Render a ColorChecker test chart through the focused optical system.

chart = renderChart(opsys);

Display the simulated ColorChecker test chart with ROI annotations overlaid on the chart.

displayChart(chart)
To assess the light‑collection efficiency across the field for this optical system, display the optical throughput data.

chart.OpticalThroughput
ans = 
  OpticalThroughput with properties:

     Throughput: [720×1280×36 double]
    Wavelengths: [380 390 400 410 420 430 440 450 460 470 480 490 500 510 520 530 540 550 560 570 580 590 600 610 620 630 640 650 660 670 680 690 700 710 720 730]
       Detector: [1×1 optics.detector.ImageSensor]

Input Arguments

collapse all

Optical system, specified as an opticalSystem object. The optical system must have an image sensor. To add an image sensor to the optical system, use the addImageSensor function.

Type of test chart to render, specified as one of these values:

  • "ColorChecker" — 24-color ColorChecker chart.

  • "eSFR2014" — ISO 12233:2014 edge SFR chart.

  • "eSFR2023-4:1" — ISO 12233:2023 pinwheel eSFR chart with 4:1 contrast ratio.

  • "eSFR2023-6:1" — ISO 12233:2023 pinwheel eSFR chart with 6:1 contrast ratio.

  • "eSFR2023-8:1" — ISO 12233:2023 pinwheel eSFR chart with 8:1 contrast ratio.

  • "eSFR2023-10:1" — ISO 12233:2023 pinwheel eSFR chart with 10:1 contrast ratio.

Data Types: char | string

Name-Value Arguments

collapse all

Specify optional pairs of arguments as Name1=Value1,...,NameN=ValueN, where Name is the argument name and Value is the corresponding value. Name-value arguments must appear after other arguments, but the order of the pairs does not matter.

Example: renderChart(opsys,"eSFR2014",Distance=500) specifies the distance from the optical system origin to the chart center as 500 millimeters.

Distance from the optical system origin to the chart center, specified as a positive scalar. Units are in millimeters. This is the distance along the z-axis from the global origin of the optical system to the center of the chart positioned on the xy-plane. If you do not specify the Distance argument, the function uses a distance that satisfies the value of FillPercent.

If you specify this argument, you cannot specify FillPercent.

Data Types: double

Percentage of the field of view to fill, specified as a scalar in the range [5, 95]. The renderChart function scales the chart to fill this percentage of the field of view, using the smaller of the horizontal, x, and vertical, y, dimensions to ensure the entire chart fits within the image.

If you specify this argument, you cannot specify Distance.

Data Types: double

Chart height, specified as a positive scalar. Units are in millimeters. If you specify Width instead of this argument, Height defaults to the value of Width divided by 1.5.

If you specify this argument, you cannot specify Width. The function determines the unspecified dimension based on a fixed 3:2 aspect ratio.

Data Types: double

Chart width, specified as a positive scalar. Units are in millimeters. If not specified, Width defaults to 1.5 times the value of Height.

If you specify this argument, you cannot specify Height. The function determines the unspecified dimension based on a fixed 3:2 aspect ratio.

Data Types: double

Focus the optical system on the chart, specified as a numeric or logical 1 (true) or 0 (false). When true, the function attempts to bring the center of the chart into best focus using the focus function.

Data Types: logical

Enable polarization effects, specified as a numeric or logical 1 (true) or 0 (false). When true, the function includes Fresnel losses and the effects of optical coatings. Enabling polarization increases computation time.

Data Types: logical

Gain factor for rendering, specified as a positive scalar. By default, the function automatically uses the maximum value that prevents clipping in sRGB space. Specify this value explicitly when comparing rendered images across system configurations.

Data Types: double

Ray tracing sample variance threshold, specified as a scalar in the range [0.004, 1]. The renderChart function randomly aggregates sampled rays per pixel until the sample variance of the optical throughput falls below this threshold value. Smaller values result in more rays traced per pixel, improving accuracy at the cost of computation time.

Increase this value to decrease run time at the expense of reduced accuracy.

Data Types: double

Use GPU for rendering, specified as one of these options.

  • "auto" – Use a GPU if available. Otherwise, use the CPU. The use of a GPU requires Parallel Computing Toolbox™ and a CUDA® enabled NVIDIA® GPU. For information about the supported compute capabilities, see GPU Computing Requirements (Parallel Computing Toolbox).

  • "on" – Use the GPU. Using a GPU requires Parallel Computing Toolbox and a CUDA-enabled NVIDIA GPU. If Parallel Computing Toolbox or a suitable GPU is not available, then the function returns an error. For information about the supported compute capabilities, see GPU Computing Requirements (Parallel Computing Toolbox).

  • "off" – Use the CPU.

Data Types: char | string

Output Arguments

collapse all

Rendered test chart, returned as a SimulatedColorCheckerChart object or a SimulatedESFRChart object. The type of the returned object depends on the value of chartType.

chartType Valuechart Output
"ColorChecker"SimulatedColorCheckerChart
"eSFR2014", "eSFR2023-4:1", "eSFR2023-6:1", "eSFR2023-8:1", "eSFR2023-10:1"SimulatedESFRChart

The renderChart function models the test chart geometrically, spectrally samples it from 380 nm to 730 nm in 10 nm increments, and illuminates it using a uniform E illuminant.

If you cancel the rendering before it completes, the renderChart function returns a partially rendered test chart.

Limitations

  • The rendered chart does not include diffraction effects.

  • If the TiltAngle and Position values of the opticalSystem object opsys are not all zeros, the renderChart function renders the chart taking these positions and tilts into account. Measurements resulting from these renders might not be accurate.

Tips

Rendering simulated test charts can be computationally intensive, and CPU run times can take several minutes. Computation speed depends on your system hardware and rendering settings.

  • For the fastest computation speeds, use a GPU. Using a GPU requires Parallel Computing Toolbox and a CUDA-enabled NVIDIA GPU. If Parallel Computing Toolbox or a suitable GPU is not available, then the function returns an error. For information about the supported compute capabilities, see GPU Computing Requirements (Parallel Computing Toolbox).

  • Systems with more CPU cores generally render faster.

  • Higher MaxSampleVariance values reduce rendering run time but can introduce noise in the rendered output.

  • Higher image sensor resolution increases rendering run time.

  • Rendering through optical systems with more surfaces and coatings requires longer run time.

  • Enabling polarization increases run time. To enable polarization effects, specify the Polarization argument as true or 1.

Version History

Introduced in R2026b