camroll
Set or query roll angle of camera for geographic globe
Description
Set Roll and Mode
camroll( sets
the roll angle of the camera for the specified geographic globe. Setting the roll angle
rotates the camera around its lens. For more information about how camera rotations affect
your view of the globe, see How Camera Orientation Affects Globe View.g,roll)

camroll( sets the camera roll to
automatic mode, enabling the geographic globe to determine the roll angle based on plotted
data. The mode defaults to automatic when you create a geographic globe. If you interact
with the globe using your mouse, then the mode switches to automatic.g,"auto")
camroll( sets the camera roll to
manual mode. When the hold state of the geographic globe is g,"manual")"on",
manual mode specifies that the geographic globe preserve the roll angle when the plotted
data changes. If you change the roll angle using the camroll
function, then the mode switches to manual.
Examples
Create a geographic globe. Position the camera near Mount Kilimanjaro by specifying a latitude, longitude, and ellipsoidal height. Set the pitch angle to 0 degrees, so that the camera points across the summit.
uif = uifigure;
g = geoglobe(uif);
campos(g,-3.1519,37.3561,5500)
campitch(g,0)

By default, the roll angle is 0 degrees. Rotate the mountain in a counterclockwise direction by increasing the roll angle to 30 degrees.
camroll(g,30)

Create a geographic globe. Position the camera near Mount Washington by specifying a latitude, longitude, and ellipsoidal height. Change the heading and pitch angles so that the camera faces the mountain.
uif = uifigure;
g = geoglobe(uif);

campos(g,44.2668,-71.3849,1757)
camheading(g,90)
campitch(g,0)

Animate the view by incrementally changing the roll angle. As the roll angle increases, the mountain rotates in a counterclockwise direction.
for roll = 0:5:180
    camroll(g,roll)
    drawnow
end

Get the position and the heading, pitch, and roll angles of the camera. Use this information to control the view of a different geographic globe or to automate navigation.
Create a geographic globe. Navigate to an area of interest using your mouse or gestures. For this example, navigate to an area around Hawaii.
uif = uifigure;
g = geoglobe(uif);

Query the latitude, longitude, and ellipsoidal height of the camera, and assign each to a variable.
[camlat,camlon,camh] = campos(g)
camlat =

   18.3172


camlon =

 -155.5891


camh =

   6.2692e+04
Query the heading, pitch, and roll angles of the camera, and assign each to a variable.
heading = camheading(g)
pitch = campitch(g)
roll = camroll(g)
heading =

    3.7590


pitch =

  -29.9880


roll =

  359.9993
Use these values to control the view of a different geographic globe. For example, create a new geographic globe and programmatically set the view.
uif2 = uifigure;
g2 = geoglobe(uif2);
campos(g2,camlat,camlon,camh)
camheading(g2,heading)
campitch(g2,pitch)
camroll(g2,roll)
In many cases, the camera view of the geographic globe changes when you plot new data. You can preserve the camera view by setting the camera modes to "manual" and the hold state to "on".
Read the buildings layer from an OpenStreetMap file [1] containing data for several city blocks in Shibuya, Tokyo, Japan. Display the buildings in a geographic globe with a road map and no terrain data.
GT = readgeotable("shibuya.osm",Layer="buildings");
addCustomBuildings("shibuya",GT)

uif = uifigure;
g = geoglobe(uif,Buildings="shibuya",Basemap="streets-light",Terrain="none");
Adjust the camera view by interacting with the globe.

Read track points from a GPX file into a geospatial table. Extract the latitude and longitude coordinates from the geospatial table, and specify a height value for each coordinate.
track = readgeotable("shibuya_track.gpx",Layer="track_points");
lat = track.Shape.Latitude;
lon = track.Shape.Longitude;
height = linspace(10,100,length(lat));
Set the camera modes to "manual" and the hold state to "on". Then, plot the data. Note that the camera position does not change.
campos(g,"manual")
camheight(g,"manual")
camheading(g,"manual")
campitch(g,"manual")
camroll(g,"manual")
hold(g,"on")

geoplot3(g,lat,lon,height,"-o",LineWidth=3)

[1] You can download OpenStreetMap files from https://www.openstreetmap.org, which provides access to crowd-sourced map data all over the world. The data is licensed under the Open Data Commons Open Database License (ODbL), https://opendatacommons.org/licenses/odbl/.
Input Arguments
More About
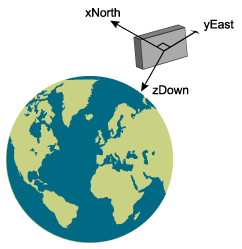
The values of the camera heading, pitch, and roll angles affect your view of a geographic globe. Mapping Toolbox™ references these values to the globe using a north-east-down (NED) coordinate system. As a result, when the heading, pitch, and roll angles of the camera are zero, the camera sits on a plane that is parallel to the tangent plane of the globe at the current latitude and longitude. For more information about NED coordinate systems, see Comparison of 3-D Coordinate Systems.
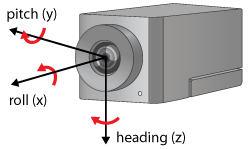
Change your view of a geographic globe by changing the heading, pitch, and roll angles of the camera:
Heading — Rotate the camera about its z-axis, which shifts the view left or right. Move the view to the right by increasing the heading angle.
Pitch — Rotate the camera about its y-axis, which tilts the view up or down. Tilt the view up by increasing the pitch angle.
Roll — Rotate the camera about its x-axis, which spins the camera around its lens. Spin the view counterclockwise by increasing the roll angle.
Tips
When the pitch angle is near –90 (the default) or 90 degrees, the camera loses one rotational degree of freedom. As a result, when you change the roll angle, the heading angle may change instead. This phenomenon is called gimbal lock. To avoid the effects of gimbal lock, call the
camheadingfunction instead of thecamrollfunction.
Version History
Introduced in R2020b
1 Alignment of boundaries and region labels are a presentation of the feature provided by the data vendors and do not imply endorsement by MathWorks®.