meshm
Project regular data grid on axesm-based map
Description
meshm( displays a
surface on the current Z,R)axesm-based map by warping the regular data grid
Z, with raster reference R, to a projected
graticule mesh. The color of the surface varies according to the values in
Z. This syntax displays the surface in a horizontal plane with all
height values set to 0.
meshm(___, specifies
surface properties using one or more name-value pair arguments. For example,
Name,Value)"FaceAlpha",0.5 creates a semitransparent plot.
s = meshm(___)s to modify the plot after creation. For
a list of properties, see Surface Properties.
Examples
Load elevation data and a geographic cells reference object for the Korean peninsula. Then, display the data on a world map using a colormap appropriate for elevation data.
load korea5c
worldmap(korea5c,korea5cR)
meshm(korea5c,korea5cR)
demcmap(korea5c)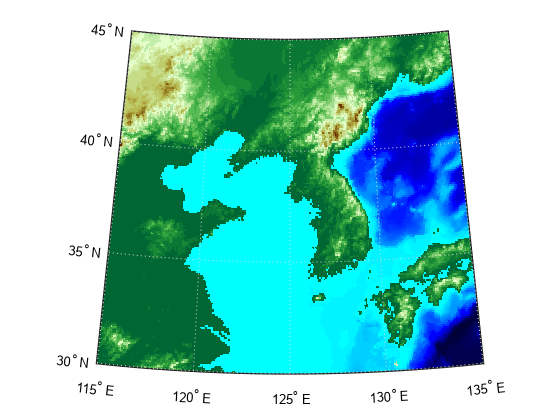
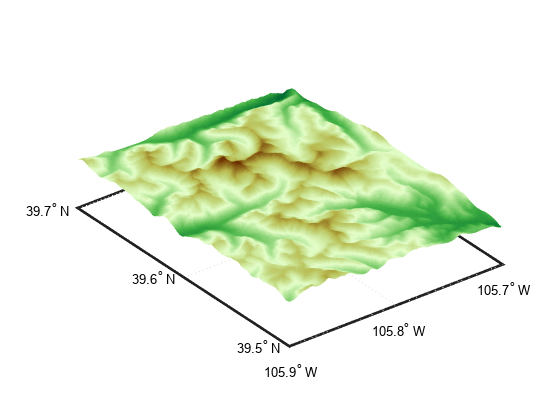
Read elevation data and a geographic postings reference object for a region around South Boulder Peak in Colorado. Crop the data to cover a smaller region.
[Z,R] = readgeoraster("n39_w106_3arc_v2.dt1",OutputType="double");
[Z,R] = geocrop(Z,R,[39.5 39.7],[-105.9 -105.7]);
Display the data as a surface by specifying the graticule size as the size of the raster (R.RasterSize) and the height data as the elevation data (Z). Apply a colormap appropriate for elevation data.
usamap(Z,R)
meshm(Z,R,R.RasterSize,Z)
demcmap(Z)
View the region in 3-D.
view(3)
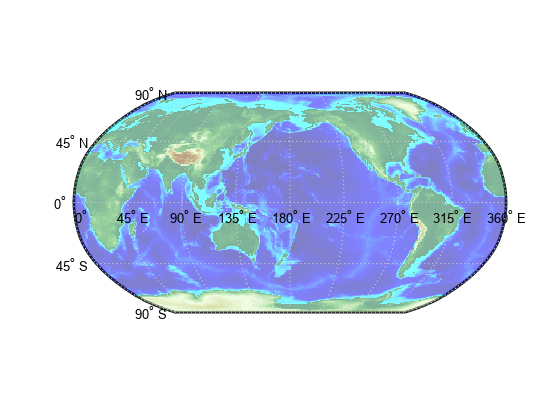
Load world elevation data as an array and a geographic cells reference object. Then, display the data on a world map. Adjust the transparency of the surface plot using the FaceAlpha name-value argument.
load topo60c
worldmap(topo60c,topo60cR)
meshm(topo60c,topo60cR,FaceAlpha=0.5)
Apply a colormap appropriate for elevation data.
demcmap(topo60c)
Input Arguments
Name-Value Arguments
Specify optional pairs of arguments as
Name1=Value1,...,NameN=ValueN, where Name is
the argument name and Value is the corresponding value.
Name-value arguments must appear after other arguments, but the order of the
pairs does not matter.
Example: meshm(Z,R,LineStyle="-") displays the graticule mesh using
solid lines.
Before R2021a, use commas to separate each name and value, and enclose
Name in quotes.
Example: meshm(Z,R,"LineStyle","-") displays the graticule mesh using
solid lines.
Note
Use name-value arguments to specify values for the properties of the
Surface object created by this function. The properties listed here are
only a subset. For a full list, see Surface Properties.
Surface objects created by the meshm
function have these limitations:
Setting the
XData,YData, andZDataproperties of the surface object is not supported.If you set the
UserDataproperty of the surface and then change the projection of theaxesm-based map, MATLAB® does not reproject the surface.
Line style, specified as one of the options listed in this table.
| Line Style | Description | Resulting Line |
|---|---|---|
"-" | Solid line |
|
"--" | Dashed line |
|
":" | Dotted line |
|
"-." | Dash-dotted line |
|
"none" | No line | No line |
Output Arguments
Tips
The
FaceColorproperty of the surface object depends on the size of the graticule mesh. Themeshmfunction setsFaceColorto"flat"when the size of the graticule mesh matches the size ofZ, and"texturemap"otherwise.The
meshmfunction projects the graticule mesh using the projection specified by theMapProjectionproperty of theaxesm-based map. To improve the resolution of the plot, increase the size of the graticule mesh. Increasing the size of the graticule mesh can increase the amount of time MATLAB requires to display the surface.