fontsize
Sintaxis
Descripción
fontsize( establece el tamaño de la fuente y las unidades de la fuente para todo el texto dentro de la figura actual. Si la figura contiene otros objetos de gráficas, como componentes de IU o un objeto de ejes con una leyenda, size,units)fontsize también establece el tamaño de la fuente y las unidades de la fuente para esos objetos de la figura. Las unidades de fuente pueden ser "points", "pixels", "inches" o "centimeters".
Antes de R2023a: Todas las sintaxis requieren un objeto de gráficas como primer argumento, como fontsize(.obj,size,units)
fontsize( aumenta el tamaño de la fuente por un factor de 1,1."increase")
fontsize( reduce el tamaño de la fuente por un factor de 0,9."decrease")
fontsize(scale= escala el tamaño de la fuente por un factor de sfactor)sfactor. Por ejemplo, utilice un factor de escalado de 1.2 para escalar por 120%.
fontsize( restablece el tamaño de la fuente y las unidades de la fuente a los valores automáticos predeterminados."default")
fontsize( establece el tamaño de la fuente para todo el texto dentro del objeto de gráficas obj,___)obj. Si obj contiene otros objetos de gráficas, fontsize también establece el tamaño de la fuente para esos objetos. Especifique obj como primer argumento de entrada en cualquiera de las sintaxis anteriores.
Ejemplos
Cree una gráfica de dos líneas con un título y una leyenda.
plot([0 1; 1 2])
title("Two Very Straight Lines")
legend("Blue Line","Red Line")

Aumente el tamaño de la fuente a 16 puntos.
fontsize(16,"points")
Antes de la versión R2023a: Especifique gcf como el primer argumento para la función fontsize. Por ejemplo, fontsize(gcf,16,"points")**.
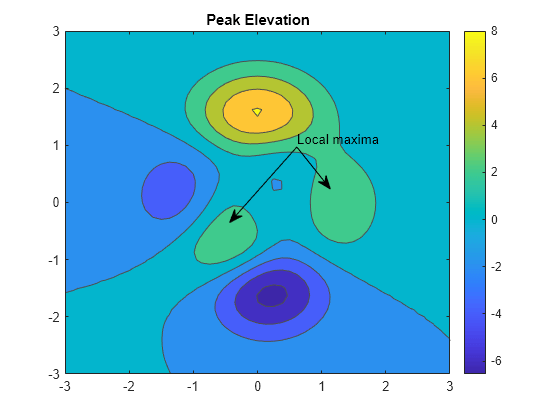
Cree una gráfica con varios elementos de texto de distintos tamaños de la fuente.
[X,Y,Z] = peaks;
contourf(X,Y,Z,LineColor="#4F4F4F")
title("Peak Elevation")
colorbar
annotation("textarrow",[.53 .41],[.65 .47],String="Local maxima")
annotation("textarrow",[.53 .59],[.65 .55])
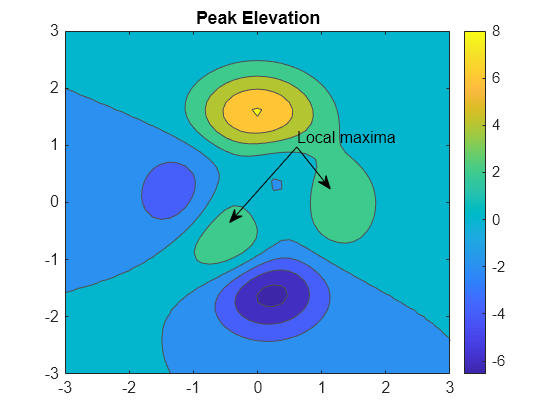
Escale los tamaños de la fuente de la figura por 120% utilizando un factor de escalado de 1,2. La función fontsize escala cada tamaño de la fuente de forma individual, manteniendo los tamaños relativos de las fuentes.
fontsize(gcf,scale=1.2)
Cree un mosaico de varias gráficas utilizando las funciones tiledlayout y nexttile.
x = linspace(0,3*pi,200);
y = cos(x) + rand(1,200);
t = tiledlayout(2,2);

% Top scatter plot in tiles 1,2
ax1 = nexttile([1 2]);
scatter(x,y)
title("Random Variance on Cosine")

% Lower polar plot in tile 3
ax2 = nexttile;
plot(x,cos(x)+0.5)

% Lower histogram in tile 4
ax3 = nexttile;
histogram(y,20)

Escale el tamaño de la fuente del diagrama de dispersión y cambie el tamaño de la fuente de las otras dos gráficas a 10 píxeles.
fontsize(ax1,scale=1.2)
fontsize([ax2 ax3],10,"pixels")
Para deshacer los cambios de tamaño de la fuente en todas las gráficas del mosaico, restablezca los tamaños de la fuente y las unidades a sus valores predeterminados. Aplique este cambio a las tres gráficas utilizando el objeto de la figura actual devuelto por gcf.
fontsize(gcf,"default")
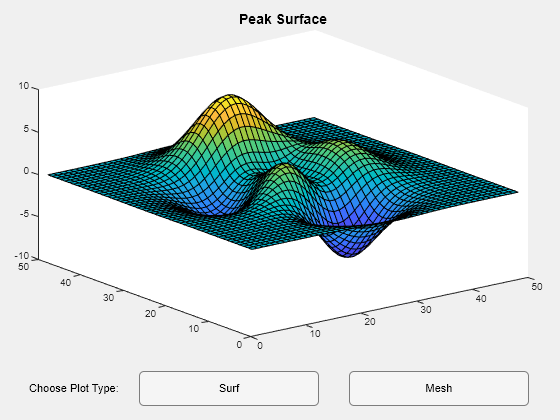
Cree el siguiente archivo de función y guárdelo como myapplayout.m en la ruta de MATLAB®. Esta función devuelve el diseño para que una app simple represente datos con distintos tipos de gráficas.
function fig = myapplayout
% Create figure window
fig = uifigure;

% Create UI components
ax = uiaxes(fig,Position=[15 70 535 340]);
lbl = uilabel(fig,Position=[30 15 100 35],Text="Choose Plot Type:");
b1 = uibutton(fig,Position=[140 15 180 35],Text="Surf");
b2 = uibutton(fig,Position=[350 15 180 35],Text="Mesh");

% Configure UI component appearance
surf(ax,peaks);
fontsize(fig,8,"pixels")
title(ax,"Peak Surface",FontSize=11)
end
Llame a la función y asigne el objeto de figura devuelto a f.
f = myapplayout;
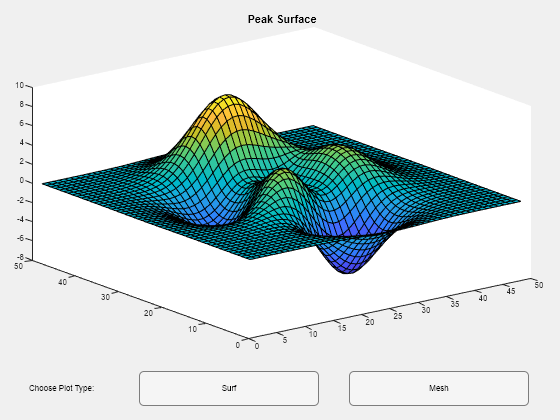
Utilice f para aumentar el tamaño de la fuente de todo el texto de la figura hasta que se pueda leer con más facilidad. En este caso, la función fontsize aumenta cada tamaño de la fuente de forma individual con un factor de escalado de 1,1 manteniendo los tamaños relativos de las fuentes.
fontsize(f,"increase")
fontsize(f,"increase")
fontsize(f,"increase")